Texas Instruments TI-73VSC Teachers Guide - Page 48
Wrap-up for Part
 |
UPC - 033317197750
View all Texas Instruments TI-73VSC manuals
Add to My Manuals
Save this manual to your list of manuals |
Page 48 highlights
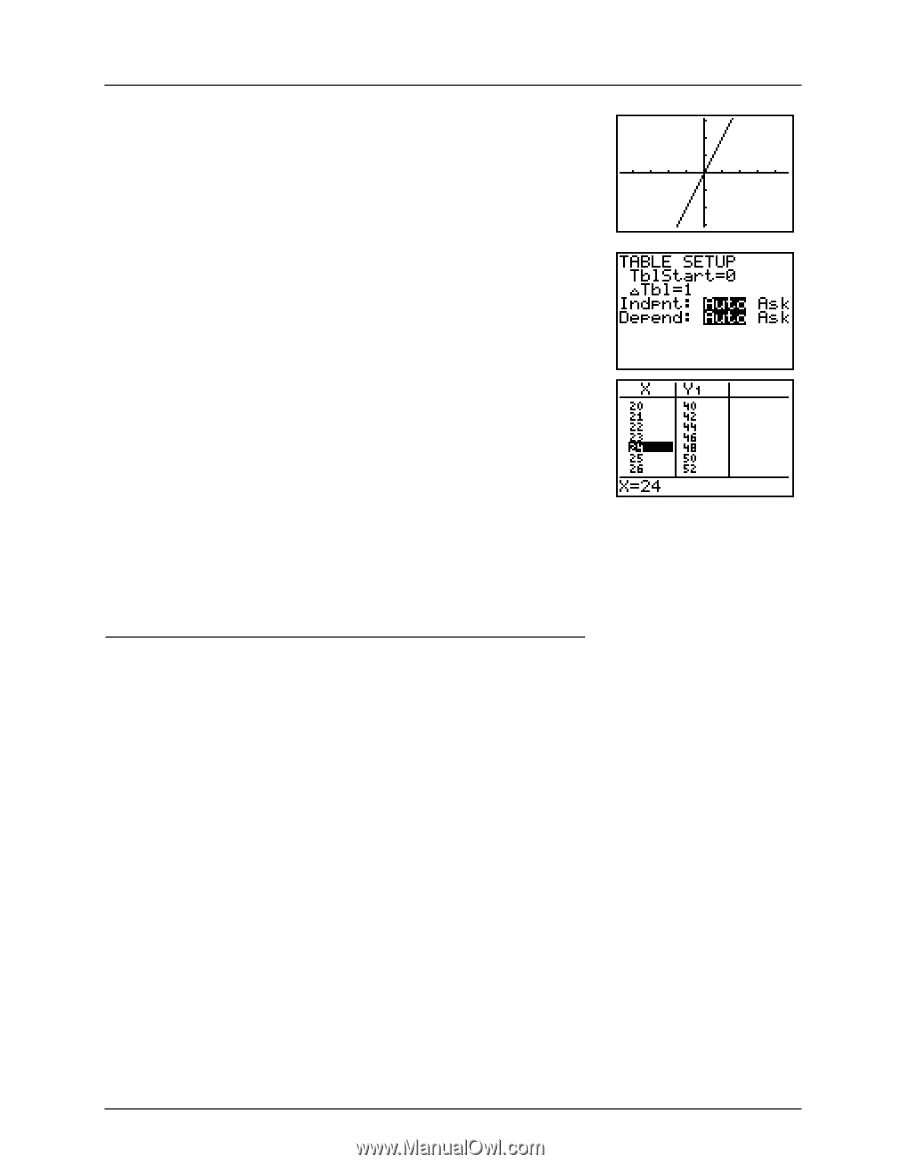
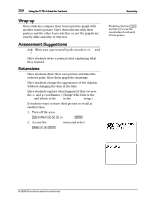
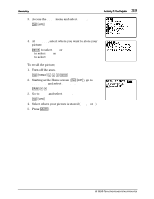
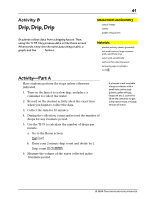
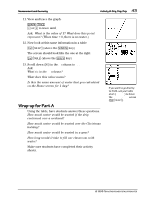
Measurement and Geometry 43 Activity 8: Drip, Drip, Drip 11. View and trace the graph. * ) ! or " to trace until X=0 Ask: What is the value of Y? What does this point represent? (When time = 0, there is no water.) 12. Now look at this same information in a table. - f (above the ' key) The screen should look like the one at the right. - i (above the * key) 13. Scroll down (#) in the X column to 24. Ask: What is in the Y1 column? What does this value mean? Is this the same amount of water that you calculated on the Home screen for 1 day? Á If you want to go directly to X=24, set your table start (TblStart) to 24 on the TABLE SETUP screen (- f). Wrap-up for Part A ♦ Using the table, have students answer these questions. How much water would be wasted if the drip continued over a weekend? How much water would be wasted over the Christmas holiday? How much water would be wasted in a year? How long would it take to fill our classroom with water? ♦ Make sure students have completed their activity sheets. © 1998 TEXAS INSTRUMENTS INCORPORATED
-
 1
1 -
2
-
3
-
4
-
5
-
6
-
7
-
8
-
9
-
10
-
11
-
12
-
13
-
14
-
15
-
16
-
17
-
18
-
19
-
20
-
21
-
22
-
23
-
24
-
25
-
26
-
27
-
28
-
29
-
30
-
31
-
32
-
33
-
34
-
35
-
36
-
37
-
38
-
39
-
40
-
41
-
42
-
 43
43 -
 44
44 -
 45
45 -
 46
46 -
 47
47 -
 48
48 -
 49
49 -
 50
50 -
 51
51 -
 52
52 -
 53
53 -
54
-
55
-
56
-
57
-
58
-
59
-
60
-
61
-
62
-
63
-
64
-
65
-
66
-
67
-
68
-
69
-
70
-
71
-
72
-
73
-
74
-
75
-
76
-
77
-
78
-
79
-
80
-
81
-
82
-
83
-
84
-
85
-
86
 |
 |