Texas Instruments TI-73VSC Teachers Guide - Page 80
graphs to color and label.
 |
UPC - 033317197750
View all Texas Instruments TI-73VSC manuals
Add to My Manuals
Save this manual to your list of manuals |
Page 80 highlights
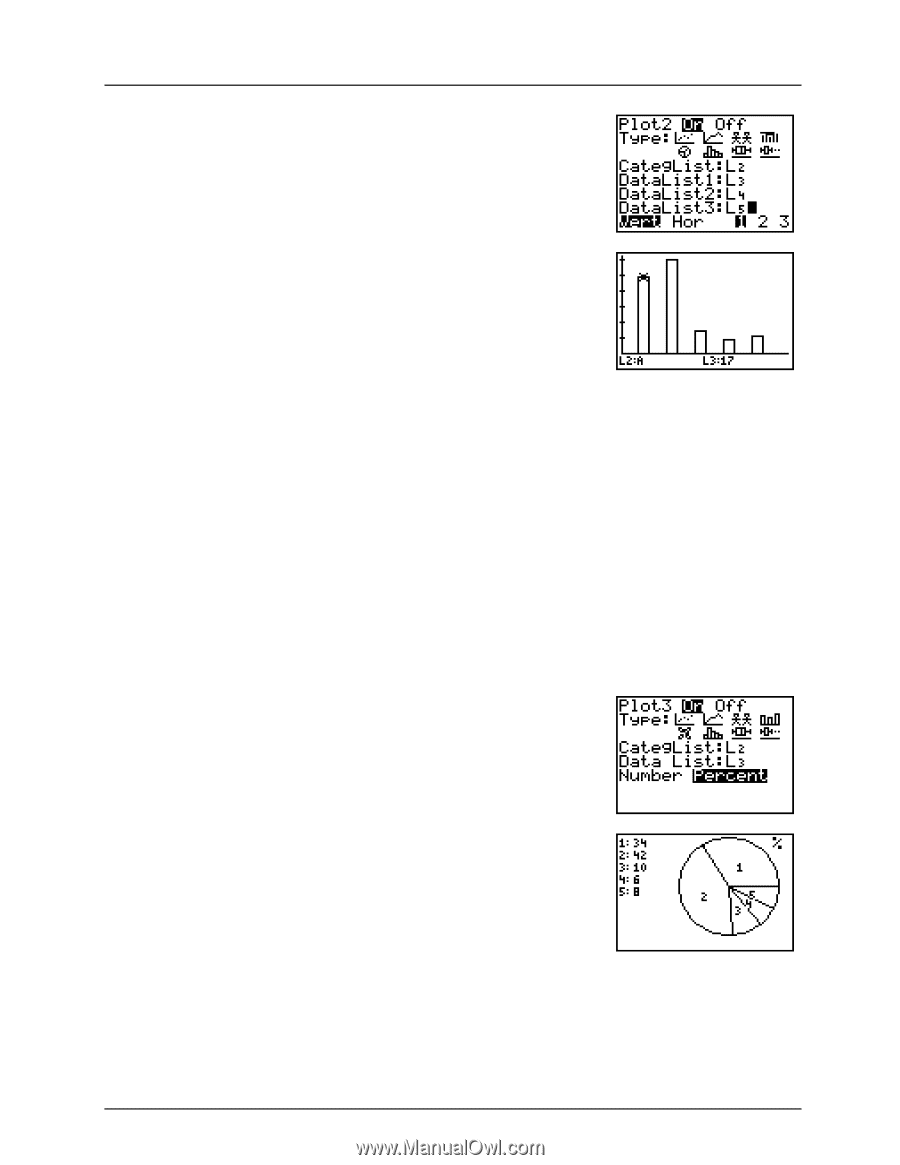
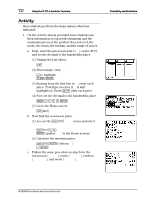
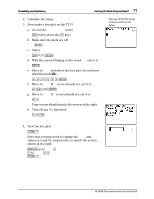
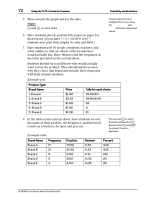
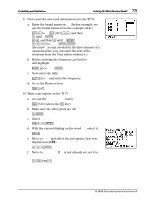
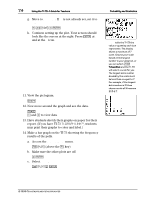
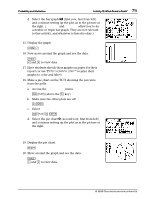
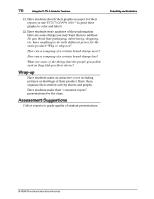
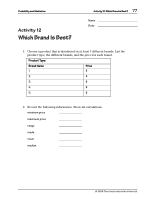
Probability and Statistics 75 Activity 12: Which Brand is Best? d. Select the bar graph Ð (first row, last from left) and continue setting up the plot as in the picture at the right. (DataList2 and DataList3 allow you to do a double or triple bar graph. They are not relevant to this activity, and whatever is listed is okay.) 15. Display the graph. ( J 16. Now move around the graph and see the data. ) ! and " to view data 17. Have students sketch their graphs on paper for their report (or use TI-73 TI-GRAPH LINKé to print their graphs to color and label). 18. Make a pie chart on the TI-73 showing the percents from the polls. a. Access the STAT PLOTS menu. - e (above the & key) b. Make sure the other plots are off. Q b c. Select Plot 3. - e [ b d. Select the pie chart Ï (second row, first from left) and continue setting up the plot as in the picture at the right. 19. Display the pie chart. * 20. Move around the graph and see the data. ) ! and " to view data © 1998 TEXAS INSTRUMENTS INCORPORATED
-
 1
1 -
2
-
3
-
4
-
5
-
6
-
7
-
8
-
9
-
10
-
11
-
12
-
13
-
14
-
15
-
16
-
17
-
18
-
19
-
20
-
21
-
22
-
23
-
24
-
25
-
26
-
27
-
28
-
29
-
30
-
31
-
32
-
33
-
34
-
35
-
36
-
37
-
38
-
39
-
40
-
41
-
42
-
43
-
44
-
45
-
46
-
47
-
48
-
49
-
50
-
51
-
52
-
53
-
54
-
55
-
56
-
57
-
58
-
59
-
60
-
61
-
62
-
63
-
64
-
65
-
66
-
67
-
68
-
69
-
70
-
71
-
72
-
73
-
74
-
 75
75 -
 76
76 -
 77
77 -
 78
78 -
 79
79 -
 80
80 -
 81
81 -
 82
82 -
 83
83 -
 84
84 -
 85
85 -
86
 |
 |