Texas Instruments TI-73VSC Teachers Guide - Page 65
Wrap-up for Part B, Assessment Suggestion for Part B, Extensions
 |
UPC - 033317197750
View all Texas Instruments TI-73VSC manuals
Add to My Manuals
Save this manual to your list of manuals |
Page 65 highlights
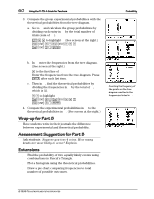
60 Using the TI-73: A Guide for Teachers 3. Compare the group experimental probabilities with the theoretical probabilities from the tree diagram. a. Go to L3 and calculate the group probabilities by dividing each entry in L3 by the total number of trials (sum of L2 ). 3 " $ to highlight L3 (See screen at the right.) - v Z F - v " " J - v Z E b Probability b. In L4 enter the frequencies from the tree diagram. (See screen at the right.) " to the first line of L4 Enter the frequencies from the tree diagram. Press b after each list item. c. Then in L5, find the theoretical probabilities by dividing the frequencies in L4 by the total of L4, which is 32. " $ to highlight L5 - v Q F - v " " J - v Q E b Á Counting the frequency of the points on the tree diagram resulted in the frequencies listed in L4. 4. Compare the experimental probabilities in L3 to the theoretical probabilities in L5. (See screen at the right.) Wrap-up for Part B Have students write in their journals the difference between experimental and theoretical probability. Assessment Suggestion for Part B Ask students: Suppose you toss 4 coins. How many heads are most likely to occur? Explain. Extensions ♦ Find the probability of two equally likely events using combinations in Pascal's Triangle. ♦ Plot a histogram using the theoretical probabilities. ♦ Draw a pie chart comparing frequencies to total number of possible outcomes. © 1998 TEXAS INSTRUMENTS INCORPORATED
-
 1
1 -
2
-
3
-
4
-
5
-
6
-
7
-
8
-
9
-
10
-
11
-
12
-
13
-
14
-
15
-
16
-
17
-
18
-
19
-
20
-
21
-
22
-
23
-
24
-
25
-
26
-
27
-
28
-
29
-
30
-
31
-
32
-
33
-
34
-
35
-
36
-
37
-
38
-
39
-
40
-
41
-
42
-
43
-
44
-
45
-
46
-
47
-
48
-
49
-
50
-
51
-
52
-
53
-
54
-
55
-
56
-
57
-
58
-
59
-
 60
60 -
 61
61 -
 62
62 -
 63
63 -
 64
64 -
 65
65 -
 66
66 -
 67
67 -
 68
68 -
 69
69 -
 70
70 -
71
-
72
-
73
-
74
-
75
-
76
-
77
-
78
-
79
-
80
-
81
-
82
-
83
-
84
-
85
-
86
 |
 |
