ZyXEL NBG-418N v2 User Guide - Page 34
Summary: Packet Statistics, Status, Poll Intervals
 |
View all ZyXEL NBG-418N v2 manuals
Add to My Manuals
Save this manual to your list of manuals |
Page 34 highlights
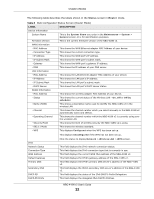
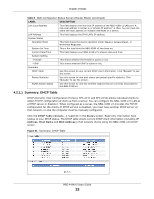
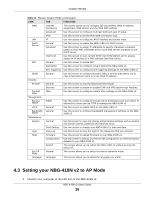
Chapter 4 Modes The following table describes the labels in this screen. Table 9 Summary: DHCP Table LABEL # DESCRIPTION This is the index number of the host computer. IP Address This field displays the IP address relative to the # field listed above. Host Name This field displays the computer host name. MAC Address This field shows the MAC address of the computer with the name in the Host Name field. Every Ethernet device has a unique MAC (Media Access Control) address which uniquely identifies a device. The MAC address is assigned at the factory and consists of six pairs of hexadecimal characters, for example, 00:A0:C5:00:00:02. IPv6 DHCP Table # This is the index number of the IPv6 DHCP table. IPv6 Address This field displays the IPv6 DHCP address. Hostname This field displays the IPv6 DHCP hostname. Refresh Click Refresh to renew the screen. 4.2.1.2 Summary: Packet Statistics Click the Packet Statistics (Details...) hyperlink in the Status screen. Read-only information here includes port status, packet specific statistics and the "system up time". The Poll Interval(s) field is configurable and is used for refreshing the screen. Figure 22 Summary: Packet Statistics The following table describes the labels in this screen. Table 10 Summary: Packet Statistics LABEL DESCRIPTION Port This is the NBG-418N v2's port type. RxPkts This is the number of received packets on this port. Rx err This is the number of received packets with errors on this port. Rx drop This is the number of received packets that were dropped on this port. Txpkts This is the number of transmitted packets on this port. Tx err This is the number of transmitted packets with errors on this port. Tx drop This is the number of transmitted packets that were dropped on this port. System Up Time This is the total time the NBG-418N v2 has been on. Poll Interval(s) Enter the time interval for refreshing statistics in this field. NBG-418N v2 User's Guide 34
-
 1
1 -
2
-
3
-
4
-
5
-
6
-
7
-
8
-
9
-
10
-
11
-
12
-
13
-
14
-
15
-
16
-
17
-
18
-
19
-
20
-
21
-
22
-
23
-
24
-
25
-
26
-
27
-
28
-
 29
29 -
 30
30 -
 31
31 -
 32
32 -
 33
33 -
 34
34 -
 35
35 -
 36
36 -
 37
37 -
 38
38 -
 39
39 -
40
-
41
-
42
-
43
-
44
-
45
-
46
-
47
-
48
-
49
-
50
-
51
-
52
-
53
-
54
-
55
-
56
-
57
-
58
-
59
-
60
-
61
-
62
-
63
-
64
-
65
-
66
-
67
-
68
-
69
-
70
-
71
-
72
-
73
-
74
-
75
-
76
-
77
-
78
-
79
-
80
-
81
-
82
-
83
-
84
-
85
-
86
-
87
-
88
-
89
-
90
-
91
-
92
-
93
-
94
-
95
-
96
-
97
-
98
-
99
-
100
-
101
-
102
-
103
-
104
-
105
-
106
-
107
-
108
-
109
-
110
-
111
-
112
-
113
-
114
-
115
-
116
-
117
-
118
-
119
-
120
-
121
-
122
-
123
-
124
-
125
-
126
-
127
-
128
-
129
-
130
-
131
-
132
-
133
-
134
-
135
-
136
-
137
-
138
-
139
-
140
-
141
-
142
-
143
-
144
-
145
-
146
-
147
-
148
-
149
-
150
-
151
-
152
-
153
-
154
-
155
-
156
-
157
-
158
-
159
-
160
-
161
-
162
-
163
-
164
-
165
-
166
-
167
-
168
-
169
-
170
-
171
-
172
-
173
-
174
-
175
-
176
-
177
-
178
-
179
-
180
-
181
-
182
-
183
-
184
-
185
-
186
-
187
-
188
-
189
-
190
-
191
-
192
-
193
-
194
-
195
-
196
-
197
-
198
-
199
-
200
-
201
-
202
-
203
-
204
-
205
-
206
-
207
-
208
-
209
-
210
-
211
-
212
-
213
-
214
-
215
-
216
-
217
-
218
-
219
-
220
-
221
-
222
-
223
-
224
-
225
-
226
-
227
-
228
 |
 |
