| Section |
Page |
| Cisco MDS 9000 Family Fabric Manager Configuration Guide, Release 3.x |
1 |
| Contents |
3 |
| New and Changed Information |
53 |
| Preface |
65 |
| Audience |
65 |
| Organization |
65 |
| Document Conventions |
70 |
| Related Documentation |
72 |
| Release Notes |
72 |
| Compatibility Information |
72 |
| Regulatory Compliance and Safety Information |
72 |
| Hardware Installation |
72 |
| Cisco Fabric Manager |
73 |
| Command-Line Interface |
73 |
| Part 1 |
81 |
| Getting Started |
81 |
| Product Overview |
83 |
| Hardware Overview |
83 |
| Cisco MDS 9500 Series Multilayer Directors |
84 |
| Cisco MDS 9200 Series Fabric Switches |
85 |
| Cisco MDS 9216i Multiprotocol Fabric Switch |
85 |
| Cisco MDS 9222i, Cisco MDS 9216A and Cisco MDS 9216 Multilayer Fabric Switches |
85 |
| Cisco MDS 9100 Series Fixed Configuration Fabric Switches |
86 |
| Cisco SAN-OS Software Configuration |
87 |
| Tools for Software Configuration |
87 |
| CLI |
88 |
| Cisco MDS 9000 Fabric Manager |
88 |
| Software Configuration Overview |
88 |
| Basic Configuration |
89 |
| Advanced Configuration |
89 |
| Switch Configuration |
89 |
| Fabric Configuration |
89 |
| Security |
90 |
| IP Services |
90 |
| Intelligent Storage Services |
90 |
| Network and Switch Monitoring |
90 |
| Traffic Management |
91 |
| Installation of Cisco MDS SAN-OS and Fabric Manager |
93 |
| Starting a Switch in the Cisco MDS 9000 Family |
93 |
| Initial Setup Routine |
94 |
| Preparing to Configure the Switch |
94 |
| Default Login |
95 |
| Setup Options |
95 |
| Assigning Setup Information |
96 |
| Configuring Out-of-Band Management |
96 |
| Configuring In-Band Management |
100 |
| Using the setup Command |
104 |
| Accessing the Switch |
104 |
| Where Do You Go Next? |
105 |
| About Cisco Fabric Manager |
105 |
| Fabric Manager Server |
106 |
| Fabric Manager Client |
106 |
| Fabric Manager Server Proxy Services |
106 |
| Device Manager |
107 |
| Performance Manager |
107 |
| Fabric Manager Web Server |
107 |
| Cisco MDS 9000 Switch Management |
107 |
| Storage Management Solutions Architecture |
108 |
| In-Band Management and Out-of-Band Management |
109 |
| mgmt0 |
109 |
| IPFC |
109 |
| Installing the Management Software |
110 |
| Before You Install |
110 |
| Supported Software |
111 |
| Minimum Hardware Requirements |
112 |
| Upgrading Fabric Manager in Cisco SAN-OS Releases Prior to 3.1(2b) |
112 |
| Upgrading Fabric Manager in Cisco SAN-OS Releases 3.1(2b) and Later to 3.2(1) |
112 |
| Installing the Database |
112 |
| Installing Oracle |
112 |
| Installing PostgreSQL |
114 |
| Increasing UDP Buffer Size |
115 |
| Database Backup and Restore-Postgres |
115 |
| Backup |
116 |
| Restore |
116 |
| Importing PM Statitics Data to Fabric Manager |
116 |
| Installing Fabric Manager |
116 |
| Creating Startup Files in Solaris |
124 |
| Installing Device Manager |
124 |
| Creating FM/DM Shortcut Manually |
126 |
| Upgrading the Management Software |
128 |
| Upgrading Fabric Manager Server and Fabric Manager Standalone Version Using the Fabric Manager Update Installer |
129 |
| Integrating Cisco Fabric Manager with Other Management Tools |
130 |
| Running Fabric Manager Behind a Firewall |
130 |
| Uninstalling the Management Software |
132 |
| Fabric Manager Server |
133 |
| Fabric Manager Server Overview |
133 |
| Fabric Manager Server Features |
133 |
| Installing and Configuring Fabric Manager Server |
134 |
| Installing Fabric Manager Server |
134 |
| Unlicensed Versus Licensed Fabric Manager Server |
135 |
| Installing Fabric Manager Web Server |
135 |
| Verifying Performance Manager Collections |
135 |
| Managing a Fabric Manager Server Fabric |
135 |
| Selecting a Fabric to Manage Continuously |
136 |
| Fabric Manager Server Properties File |
137 |
| Modifying Fabric Manager Server |
138 |
| Adding or Removing Fabric Manager Server Users |
138 |
| Changing the Fabric Manager Server User Name and Password |
139 |
| Changing the Polling Period and Fabric Rediscovery Time |
139 |
| Using Device Aliases or FC Aliases |
140 |
| Saving Device Aliases to the Switch |
140 |
| Authentication in Fabric Manager |
141 |
| Fabric Manager Authentication Overview |
141 |
| Best Practices for Discovering a Fabric |
143 |
| Setting Up Discovery for a Fabric |
143 |
| Performance Manager Authentication |
144 |
| Fabric Manager Web Server Authentication |
145 |
| Fabric Manager Client |
147 |
| About Fabric Manager Client |
147 |
| Fabric Manager Advanced Mode |
148 |
| Launching Fabric Manager Client in Cisco SAN-OS Release 3.2(1) and Later |
148 |
| Fabric Manager Client Quick Tour |
152 |
| Menu Bar |
153 |
| Toolbar |
154 |
| Logical Domains Pane |
155 |
| Filtering |
156 |
| Physical Attributes Pane |
156 |
| Information Pane |
156 |
| Detachable Tables |
158 |
| Fabric Pane |
158 |
| Context Menus |
160 |
| Saving the Map |
160 |
| Purging Down Elements |
161 |
| Multiple Fabric Display |
161 |
| Filtering by Groups |
162 |
| Status Bar |
164 |
| Setting Fabric Manager Preferences |
164 |
| Network Fabric Discovery |
165 |
| Modifying the Device Grouping |
166 |
| Using Alias Names as Enclosures |
166 |
| Controlling Administrator Access with Users and Roles |
167 |
| Using Fabric Manager Wizards |
167 |
| Fabric Manager Troubleshooting Tools |
168 |
| Device Manager |
169 |
| Device Manager Overview |
169 |
| Device Manager Features |
169 |
| Launching Device Manager |
170 |
| Using Device Manager |
170 |
| Menu Bar |
172 |
| Toolbar Icons |
172 |
| Dialog Boxes |
173 |
| Tabs |
173 |
| Legend |
174 |
| Supervisor and Switching Modules |
175 |
| Context Menus |
175 |
| Setting Device Manager Preferences |
176 |
| Fabric Manager Web Server |
177 |
| Fabric Manager Web Server Overview |
177 |
| Navigating Fabric Manager Web Server |
178 |
| Navigation Tree |
178 |
| Table Filtering and Navigation |
179 |
| Printing |
179 |
| Exporting to a File |
179 |
| Sorting Columns |
179 |
| Installing Fabric Manager Web Server |
179 |
| Using Fabric Manager Web Server with SSL |
181 |
| Launching Fabric Manager Web Server |
183 |
| Health |
184 |
| Viewing Summary Information |
185 |
| Viewing Fabric Information |
185 |
| Viewing Syslog Information |
186 |
| Viewing Analysis Reports |
187 |
| Performance |
188 |
| Viewing Performance Summary Information |
189 |
| Viewing Performance Information for End Devices |
190 |
| Viewing Performance Information for ISLs |
191 |
| Viewing Performance Information for Flows |
192 |
| Viewing Performance Information for GigE Ports |
193 |
| Viewing Other Statistics |
193 |
| Viewing Detailed Traffic Information |
194 |
| Viewing Predicted Future Performance |
195 |
| Using the Default Values |
195 |
| Using Your Own Values |
196 |
| Viewing Switch Bandwidth |
197 |
| Inventory |
198 |
| Viewing Detailed Information for VSANs |
198 |
| Viewing Detailed Information for Switches |
199 |
| Viewing License Information |
200 |
| Viewing Detailed Information for Modules |
200 |
| Viewing Detailed Information for End Devices |
201 |
| Viewing Detailed Information for ISLs |
202 |
| Viewing Detailed Information for Zones |
203 |
| Viewing Summary Inventory Information |
204 |
| Custom |
205 |
| Creating a Custom Report Template |
205 |
| Viewing Custom Reports by Template |
207 |
| Generating Custom Reports by Template |
207 |
| Modifying a Custom Report Template |
208 |
| Viewing Scheduled Jobs by Report Template |
209 |
| Admin |
210 |
| Recovering a Web Server Password |
211 |
| Starting, Restarting, and Stopping Services |
211 |
| Adding, Editing, and Removing Managed Fabrics |
212 |
| Viewing Trap and Syslog Registration Information |
214 |
| Configuring Forwarding of Notifications for Events |
215 |
| Viewing and Disconnecting Clients |
216 |
| Configuring Fabric Manager Server Preferences |
217 |
| Adding and Removing Communities |
217 |
| Configuring AAA Information |
219 |
| Adding and Removing Users |
219 |
| Adding and Removing Roles |
220 |
| Creating Performance Collections |
222 |
| Configuring Other Statistics |
223 |
| Configuring Collection Thresholds |
225 |
| Configuring the RRD Database |
226 |
| Viewing Log Information |
227 |
| Download |
227 |
| Downloading Fabric Manager Client |
227 |
| Performance Manager |
229 |
| Performance Manager Architecture |
229 |
| Data Interpolation |
230 |
| Data Collection |
230 |
| Using Performance Thresholds |
230 |
| Flow Setup Wizards |
231 |
| Flow Statistics Configuration |
231 |
| About Flow Statistics |
232 |
| Counting Flow Statistics |
232 |
| Cisco Traffic Analyzer |
235 |
| Understanding SPAN |
235 |
| Using Cisco Traffic Analyzer with Performance Manager |
236 |
| Understanding the PAA-2 |
236 |
| Understanding Cisco Traffic Analyzer |
237 |
| Installing Cisco Traffic Analyzer |
237 |
| Accessing Traffic Analyzer from Fabric Manager Web Server |
239 |
| Part 2 |
241 |
| Cisco MDS SAN-OS Installation and Switch Management |
241 |
| Obtaining and Installing Licenses |
243 |
| Licensing Terminology |
243 |
| Licensing Model |
244 |
| Licensing High Availability |
250 |
| Options to Install a License |
250 |
| Obtaining a Factory-Installed License |
251 |
| Performing a Manual Installation |
251 |
| Obtaining the License Key File |
251 |
| Installing the License Key File |
252 |
| Installing Licenses Using Fabric Manager License Wizard |
253 |
| Installing or Updating Licenses Using Device Manager |
254 |
| Identifying License Features in Use |
255 |
| Uninstalling Licenses |
256 |
| Updating Licenses |
256 |
| Grace Period Alerts |
257 |
| License Transfers Between Switches |
258 |
| Displaying License Information |
258 |
| Viewing License Information in Fabric Manager |
258 |
| Viewing License Information in Device Manager |
258 |
| Viewing Licenses Using Fabric Manager Web Server |
259 |
| Fabric Manager Server Licensing |
259 |
| On-Demand Port Activation Licensing |
261 |
| About On-Demand Port Activation Licensing |
261 |
| Port-Naming Conventions |
262 |
| Port Licensing |
262 |
| License Status Definitions |
263 |
| Configuring Port Activation Licenses |
264 |
| Checking the Status of Licenses |
264 |
| Making a Port Eligible for a License |
265 |
| Acquiring a License for a Port |
266 |
| Initial Configuration |
269 |
| Assigning a Switch Name |
269 |
| Verifying the Module Status |
270 |
| Configuring Date, Time, and Time Zone |
271 |
| NTP Configuration |
272 |
| About NTP |
272 |
| NTP Configuration Guidelines |
273 |
| Configuring NTP |
274 |
| Edit an NTP Server or Peer Configuration |
274 |
| Delete an NTP Server or Peer |
275 |
| NTP CFS Distribution |
276 |
| Configure NTP with CFS |
276 |
| Committing NTP Configuration Changes |
277 |
| Discarding NTP Configuration Changes |
277 |
| Releasing Fabric Session Lock |
277 |
| Database Merge Guidelines |
278 |
| Management Interface Configuration |
278 |
| Default Gateway Configuration |
279 |
| Telnet Server Connection |
279 |
| Disabling a Telnet Connection |
279 |
| Configuring CDP |
280 |
| Using the CFS Infrastructure |
283 |
| About CFS |
283 |
| Cisco SAN-OS Features Using CFS |
284 |
| CFS Features |
284 |
| CFS Protocol |
285 |
| CFS Distribution Scopes |
285 |
| CFS Distribution Modes |
286 |
| Uncoordinated Distribution |
286 |
| Coordinated Distribution |
286 |
| Unrestricted Uncoordinated Distributions |
286 |
| Disabling CFS Distribution on a Switch |
286 |
| CFS Application Requirements |
287 |
| Enabling CFS for an Application |
288 |
| Locking the Fabric |
289 |
| Committing Changes |
289 |
| Discarding Changes |
290 |
| Saving the Configuration |
290 |
| Clearing a Locked Session |
290 |
| CFS Merge Support |
291 |
| Displaying CFS Configuration Information |
291 |
| CFS Distribution over IP |
292 |
| CFS Regions |
294 |
| About CFS Regions |
294 |
| Managing CFS Regions Using Fabric Manager |
295 |
| Creating CFS Regions |
295 |
| Assigning Features to CFS Regions |
295 |
| Moving a Feature to a Different Region |
296 |
| Removing a Feature from a Region |
297 |
| Deleting CFS Regions |
297 |
| CFS Example Using Fabric Manager |
298 |
| CFS Example Using Device Manager |
301 |
| Default Settings |
301 |
| Configuring FlexAttach Virtual pWWN |
303 |
| About FlexAttach Virtual pWWN |
303 |
| FlexAttach Virtual pWWN Guidelines and Requirements |
303 |
| Configuring FlexAttach Virtual pWWN |
303 |
| Enabling FlexAttach Virtual pWWN |
304 |
| Automatically Enabling FlexAttach Virtual pWWN |
304 |
| Launching FlexAttach in Fabric Manager |
305 |
| Manually Enabling FlexAttach Virtual pWWN |
306 |
| Mapping pWWN to Virtual pWWN |
308 |
| Debugging FlexAttach Virtual pWWN |
310 |
| Security Settings for FlexAttach Virtual pWWN |
310 |
| FlexAttach Virtual pWWN CFS Distribution |
311 |
| Difference Between San Device Virtualization and FlexAttach Port Virtualization |
311 |
| Software Images |
313 |
| About Software Images |
313 |
| Dependent Factors for Software Installation |
313 |
| Selecting the Correct Software Images for Cisco MDS 9100 Series Switches |
314 |
| Selecting the Correct Software Images for Cisco MDS 9200 Series Switches |
314 |
| Selecting the Correct Software Images for Cisco MDS 9500 Family Switches |
314 |
| Essential Upgrade Prerequisites |
315 |
| Software Upgrade Methods |
317 |
| Determining Software Compatibility |
317 |
| Automated Upgrades |
318 |
| Benefits of Using the Software Install Wizard |
318 |
| Recognizing Failure Cases |
319 |
| Using the Software Install Wizard |
320 |
| Upgrading Services Modules |
323 |
| Non-Disruptive Upgrades on Fabric and Modular Switches |
324 |
| Preparing for a Non-Disruptive Upgrade on Fabric and Modular Switches |
324 |
| Performing a Non-Disruptive Upgrade on a Fabric Switch |
325 |
| Maintaining Supervisor Modules |
325 |
| Replacing Supervisor Modules |
326 |
| Standby Supervisor Module Boot Variable Version |
326 |
| Standby Supervisor Module Bootflash Memory |
326 |
| Standby Supervisor Module Boot Alert |
326 |
| Installing Generation 2 Modules in Generation 1 Chassis |
327 |
| Replacing Modules |
327 |
| Default Settings |
328 |
| Managing Configuration Files |
329 |
| About Flash Devices |
329 |
| Internal bootflash: |
330 |
| Formatting Flash Devices and File Systems |
330 |
| Initializing Internal bootflash: |
330 |
| Using the File System |
331 |
| Flash Files |
331 |
| Creating a Directory |
332 |
| Deleting an Existing File or Directory |
333 |
| Copying Files |
334 |
| Performing Other File Manipulation Tasks |
335 |
| Working with Configuration Files |
336 |
| Downloading Configuration Files to the Switch |
336 |
| Saving the Configuration |
336 |
| Saving the Running Configuration |
336 |
| Saving Startup Configurations in the Fabric |
337 |
| Backing Up the Current Configuration |
337 |
| Configuring High Availability |
339 |
| About High Availability |
339 |
| Switchover Mechanisms |
340 |
| HA Switchover Characteristics |
340 |
| Initiating a Switchover |
340 |
| Switchover Guidelines |
341 |
| Process Restartability |
341 |
| Synchronizing Supervisor Modules |
341 |
| Managing System Hardware |
345 |
| Displaying Switch Hardware Inventory |
345 |
| ,Running the CompactFlash Report |
346 |
| Displaying the Switch Serial Number |
347 |
| Displaying Power Usage Information |
347 |
| Power Supply Configuration Modes |
348 |
| Power Supply Configuration Guidelines |
349 |
| About Crossbar Management |
351 |
| Operational Considerations When Removing Crossbars |
352 |
| Graceful Shutdown of a Crossbar |
352 |
| Backward Compatibility for Generation 1 Modules in Cisco MDS 9513 Directors |
354 |
| About Module Temperature |
354 |
| Displaying Module Temperature |
355 |
| About Fan Modules |
355 |
| Default Settings |
356 |
| Managing Modules |
357 |
| About Modules |
357 |
| Supervisor Modules |
358 |
| Switching Modules |
359 |
| Services Modules |
359 |
| Verifying the Status of a Module |
359 |
| Obtaining Supervisor Module Statistics |
360 |
| Checking the State of a Module |
360 |
| Reloading Modules |
361 |
| Reloading a Switch |
361 |
| Power Cycling Modules |
362 |
| Preserving Module Configuration |
363 |
| Powering Off Switching Modules |
364 |
| Identifying Module LEDs |
365 |
| Default Settings |
368 |
| Part 3 |
371 |
| Switch Configuration |
371 |
| Configuring Interfaces |
373 |
| Common Interface Configuration |
373 |
| Fibre Channel Interfaces |
374 |
| 32-Port Switching Module Configuration Guidelines |
374 |
| About Interface Modes |
375 |
| E Port |
376 |
| F Port |
377 |
| FL Port |
377 |
| NP Ports |
377 |
| TL Port |
377 |
| TE Port |
378 |
| SD Port |
378 |
| ST Port |
378 |
| Fx Port |
378 |
| B Port |
378 |
| Auto Mode |
379 |
| About Interface States |
379 |
| Administrative States |
379 |
| Operational States |
379 |
| Reason Codes |
380 |
| Graceful Shutdown |
383 |
| Setting the Interface Administrative State |
383 |
| Configuring Interface Modes |
384 |
| Configuring Administrative Speeds |
384 |
| Autosensing |
385 |
| About Interface Descriptions |
385 |
| About Frame Encapsulation |
385 |
| About Receive Data Field Size |
385 |
| Configuring Receive Data Field Size |
385 |
| Identifying the Beacon LEDs |
386 |
| About Speed LEDs |
386 |
| About Beacon Mode |
387 |
| Configuring Beacon Mode |
387 |
| About Bit Error Thresholds |
387 |
| Switch Port Attribute Default Values |
388 |
| About SFP Transmitter Types |
388 |
| Displaying SFP Transmitter Types |
388 |
| About Gathering Interface Statistics |
389 |
| Gathering Interface Statistics |
389 |
| TL Ports for Private Loops |
390 |
| About TL Ports |
390 |
| Configuring TL Ports |
391 |
| About TL Port ALPA Caches |
391 |
| Buffer Credits |
392 |
| About Buffer-to-Buffer Credits |
392 |
| Configuring Buffer-to-Buffer Credits |
392 |
| About Performance Buffers |
393 |
| Configuring Performance Buffers |
393 |
| About Extended BB_credits |
393 |
| Extended BB_credits on Generation 1 Switching Modules |
394 |
| Extended BB_credits on Generation 2 Switching Modules |
395 |
| Configuring Extended BB_credits |
395 |
| Management Interfaces |
395 |
| About Management Interfaces |
395 |
| Configuring Management Interfaces |
396 |
| VSAN Interfaces |
396 |
| About VSAN Interfaces |
396 |
| Creating VSAN Interfaces |
397 |
| Default Settings |
398 |
| Configuring N Port Virtualization |
399 |
| About NPV |
399 |
| NP Ports |
401 |
| NP Links |
401 |
| Internal FLOGI Parameters |
401 |
| Default Port Numbers |
402 |
| NPV Guidelines and Requirements |
402 |
| Configuring NPV |
403 |
| Multiple VSAN Support |
403 |
| Configuring NPV with Fabric Manager |
403 |
| Using the NPV Setup Wizard |
404 |
| Configuring NPV with Fabric Manager |
418 |
| DPVM Configuration |
419 |
| NPV and Port Security |
420 |
| Configuring Generation 2 Switches and Modules |
421 |
| About Generation 2 Modules and Switches |
421 |
| Port Groups |
422 |
| Port Rate Modes |
424 |
| Dedicated Mode |
426 |
| Shared Mode |
426 |
| Dynamic Bandwidth Management |
426 |
| Out-of-Service Interfaces |
427 |
| Buffer Credit Allocation |
427 |
| Buffer Pools |
428 |
| BB_Credit Buffers for Switching Modules |
429 |
| 48-port 4-Gbps Fibre Channel Module BB_Credit Buffers |
429 |
| 24-port 4-Gbps Fibre Channel Module BB_Credit Buffers |
431 |
| 18-Port Fibre Channel/4-Port GigabitEthernet Multiservice Module BB_Credit Buffers |
432 |
| 12-Port 4-Gbps Switching Module BB_Credit Buffers |
432 |
| 4-Port 10-Gbps Switching Module BB_Credit Buffers |
433 |
| BB_Credit Buffers for Fabric Switches |
434 |
| Cisco MDS 9134 Fabric Switch BB_Credit Buffers |
434 |
| Cisco MDS 9124 Fabric Switch BB_Credit Buffers |
434 |
| Cisco MDS 9222i Multiservice Modular Switch BB_Credit Buffers |
435 |
| Extended BB_Credits |
435 |
| About Combining Generation 1 and Generation 2 Switching Modules |
435 |
| Port Indexes |
436 |
| PortChannels |
437 |
| Configuring Generation 2 Module Interface Shared Resources |
438 |
| Configuration Guidelines for 48-Port and 24-Port 4-Gbps Fibre Channel Switching Modules |
439 |
| Migrating from Shared Mode to Dedicated Mode |
439 |
| Migrating from Dedicated Mode to Shared Mode |
439 |
| Configuration Guidelines for 12-Port 4-Gbps Switching Module Interfaces |
440 |
| Configuration Guidelines for 4-Port 10-Gbps Switching Module Interfaces |
440 |
| Configuring Port Speed |
441 |
| Configuring Rate Mode |
442 |
| Configuring Oversubscription Ratio Restrictions |
443 |
| Disabling Restrictions on Oversubscription Ratios |
444 |
| Enabling Restrictions on Oversubscription Ratios |
445 |
| Configuring Bandwidth Fairness |
446 |
| Enabling Bandwidth Fairness |
446 |
| Disabling Bandwidth Fairness |
447 |
| Upgrade or Downgrade Scenario |
448 |
| Taking Interfaces Out of Service |
448 |
| Releasing Shared Resources in a Port Group |
449 |
| Displaying SFP Diagnostic Information |
450 |
| Default Settings |
451 |
| Configuring PortChannels |
453 |
| About PortChannels |
453 |
| PortChannel Examples |
454 |
| 32-Port Switching Module Configuration Guidelines |
454 |
| About PortChanneling and Trunking |
455 |
| About Load Balancing |
456 |
| PortChannel Configuration |
458 |
| About PortChannel Configuration |
460 |
| Configuring PortChannels |
460 |
| About PortChannel Modes |
463 |
| About PortChannel Deletion |
464 |
| Deleting PortChannels |
464 |
| Interfaces in a PortChannel |
465 |
| About Interface Addition to a PortChannel |
465 |
| Compatibility Check |
466 |
| Suspended and Isolated States |
466 |
| Adding an Interface to a PortChannel |
466 |
| Forcing an Interface Addition |
467 |
| About Interface Deletion from a PortChannel |
468 |
| Deleting an Interface from a PortChannel |
468 |
| PortChannel Protocol |
468 |
| About Channel Group Creation |
469 |
| About Autocreation |
470 |
| Enabling and Configuring Autocreation |
471 |
| About Manually Configured Channel Groups |
471 |
| Converting to Manually Configured Channel Groups |
471 |
| PortChannel Configuration Verification |
472 |
| Default Settings |
472 |
| Configuring Trunking |
475 |
| About Trunking |
475 |
| Trunking Configuration Guidelines |
476 |
| Trunking Protocol |
476 |
| About Trunk Mode |
477 |
| Configuring Trunk Mode |
477 |
| About Trunk-Allowed VSAN Lists |
478 |
| Configuring an Allowed-Active List of VSANs |
480 |
| Default Settings |
480 |
| Configuring Domain Parameters |
483 |
| Fibre Channel Domains |
484 |
| About Domain Restart |
485 |
| Restarting a Domain |
485 |
| About Switch Priority |
486 |
| Configuring Switch Priority |
487 |
| About fcdomain Initiation |
487 |
| Enabling or Disabling fcdomains |
487 |
| Setting Fabric Names |
488 |
| About Incoming RCFs |
488 |
| Rejecting Incoming RCFs |
488 |
| About Autoreconfiguring Merged Fabrics |
489 |
| Enabling Autoreconfiguration |
489 |
| Domain IDs |
490 |
| About Domain IDs |
490 |
| Specifying Static or Preferred Domain IDs |
492 |
| About Allowed Domain ID Lists |
493 |
| Configuring Allowed Domain ID Lists |
493 |
| About CFS Distribution of Allowed Domain ID Lists |
494 |
| Enabling Distribution |
494 |
| Locking the Fabric |
495 |
| Committing Changes |
495 |
| Discarding Changes |
495 |
| Clearing a Fabric Lock |
496 |
| Displaying Pending Changes |
496 |
| Displaying Session Status |
496 |
| About Contiguous Domain ID Assignments |
497 |
| Enabling Contiguous Domain ID Assignments |
497 |
| FC IDs |
498 |
| About Persistent FC IDs |
499 |
| Enabling the Persistent FC ID Feature |
499 |
| About Persistent FC ID Configuration |
499 |
| Configuring Persistent FC IDs |
500 |
| About Unique Area FC IDs for HBAs |
501 |
| Configuring Unique Area FC IDs for an HBA |
501 |
| About Persistent FC ID Selective Purging |
503 |
| Purging Persistent FC IDs |
503 |
| Displaying fcdomain Statistics |
504 |
| Default Settings |
504 |
| Part 4 |
507 |
| Fabric Configuration |
507 |
| Configuring and Managing VSANs |
509 |
| About VSANs |
509 |
| VSANs Topologies |
509 |
| VSAN Advantages |
511 |
| VSANs Versus Zones |
512 |
| VSAN Configuration |
513 |
| About VSAN Creation |
514 |
| Creating VSANs Statically |
514 |
| About Port VSAN Membership |
515 |
| Assigning Static Port VSAN Membership |
516 |
| About the Default VSAN |
516 |
| About the Isolated VSAN |
516 |
| Displaying Isolated VSAN Membership |
517 |
| Operational State of a VSAN |
517 |
| About Static VSAN Deletion |
517 |
| Deleting Static VSANs |
518 |
| About Load Balancing |
519 |
| Configuring Load Balancing |
519 |
| About Interop Mode |
520 |
| About FICON VSANs |
520 |
| Default Settings |
520 |
| SAN Device Virtualization |
521 |
| About SDV |
521 |
| Key Concepts |
523 |
| Configuring SDV |
524 |
| Configuring a Virtual Device |
524 |
| Linking a Virtual Device with a Physical Device |
526 |
| Resolving Fabric Merge Conflicts |
527 |
| SDV Requirements and Guidelines |
528 |
| Default Settings |
529 |
| Creating Dynamic VSANs |
531 |
| DPVM |
531 |
| About DPVM Configuration |
532 |
| Configuring DPVM with the DPVM Wizard |
532 |
| About DPVM Databases |
533 |
| Configuring DPVM Config and Pending Databases |
534 |
| Activating DPVM Config Databases |
535 |
| Viewing the Pending Database |
536 |
| About Autolearned Entries |
537 |
| Enabling Autolearning |
537 |
| Clearing Learned Entries |
538 |
| DPVM Database Distribution |
538 |
| About DPVM Database Distribution |
539 |
| Disabling DPVM Database Distribution |
539 |
| About Locking the Fabric |
540 |
| Locking the Fabric |
540 |
| Committing Changes |
541 |
| Discarding Changes |
542 |
| Clearing a Locked Session |
542 |
| Database Merge Guidelines |
542 |
| About Copying DPVM Databases |
543 |
| Copying DPVM Databases |
543 |
| Comparing Database Differences |
543 |
| Default Settings |
544 |
| Configuring Inter-VSAN Routing |
545 |
| Inter-VSAN Routing |
545 |
| About IVR |
546 |
| IVR Features |
547 |
| IVR Terminology |
547 |
| IVR Limits Summary |
548 |
| Fibre Channel Header Modifications |
548 |
| IVR NAT |
549 |
| IVR NAT Requirements and Guidelines |
549 |
| IVR VSAN Topology |
550 |
| Autonomous Fabric ID |
551 |
| IVR Interoperability |
551 |
| About the IVR Zone Wizard |
551 |
| Configuring IVR Using the IVR Zone Wizard |
551 |
| Manual IVR Configuration |
553 |
| About IVR NAT and Auto Topology |
554 |
| Transit VSAN Guidelines |
554 |
| Border Switch Guidelines |
554 |
| Configuring IVR NAT and IVR Auto Topology |
556 |
| About AFIDs |
556 |
| Configuring Default AFIDs |
556 |
| Configuring Individual AFIDs |
557 |
| About IVR Without IVR NAT or Auto Topology |
557 |
| Domain ID Guidelines |
558 |
| Transit VSAN Guidelines |
558 |
| Border Switch Guidelines |
559 |
| Configuring IVR Without NAT |
559 |
| Manually Creating the IVR Topology |
559 |
| Activating a Manually Configured IVR Topology |
561 |
| Clearing the Configured IVR Topology |
561 |
| Migrating from IVR Auto Topology Mode to Manual Mode |
562 |
| About IVR Virtual Domains |
562 |
| Configuring IVR Virtual Domains |
563 |
| About Persistent FC IDs for IVR |
563 |
| Configuring Persistent FC IDs for IVR |
564 |
| Configuring IVR Logging Levels |
565 |
| IVR Zones and IVR Zone Sets |
566 |
| About IVR Zones |
566 |
| Automatic IVR Zone Creation |
567 |
| Configuring IVR Zones and IVR Zone Sets |
568 |
| About Activating Zone Sets and Using the force Option |
570 |
| Recovering an IVR Full Zone Database |
572 |
| Recovering an IVR Full Topology |
573 |
| About LUNs in IVR Zoning |
574 |
| Configuring LUNs in IVR Zoning |
574 |
| About QoS in IVR Zones |
574 |
| Configuring QoS for IVR Zones |
574 |
| Renaming IVR Zones and IVR Zone Sets |
574 |
| Clearing the IVR Zone Database |
575 |
| Configuring IVR Using Read-Only Zoning |
575 |
| System Image Downgrading Considerations |
575 |
| Database Merge Guidelines |
575 |
| Resolving Database Merge Failures |
577 |
| Default Settings |
578 |
| Configuring and Managing Zones |
579 |
| About Zoning |
579 |
| Zoning Example |
580 |
| Zone Implementation |
581 |
| Active and Full Zone Set Considerations |
583 |
| Using the Quick Config Wizard |
585 |
| Zone Configuration |
588 |
| About the Edit Full Zone Database Tool |
589 |
| Configuring a Zone Using the Zone Configuration Tool |
590 |
| Adding Zone Members |
592 |
| Zone Sets |
593 |
| About Zone Set Creation |
594 |
| Activating a Zone Set |
595 |
| Displaying Zone Membership Information |
597 |
| About the Default Zone |
597 |
| Configuring the Default Zone |
598 |
| About FC Alias Creation |
598 |
| Creating FC Aliases |
599 |
| Adding Members to Aliases |
599 |
| Converting Zone members to pWWN-based Members |
601 |
| Zone Enforcement |
603 |
| Zone Set Distribution |
603 |
| Enabling Full Zone Set Distribution |
603 |
| Enabling a One-Time Distribution |
604 |
| About Recovering from Link Isolation |
605 |
| Importing and Exporting Zone Sets |
605 |
| Zone Set Duplication |
606 |
| Copying Zone Sets |
607 |
| About Backing Up and Restoring Zones |
607 |
| Backing Up and Restoring Zones |
608 |
| Renaming Zones, Zone Sets, and Aliases |
608 |
| Cloning Zones, Zone Sets, FC Aliases, and Zone Attribute Groups |
609 |
| Migrating a Non-MDS Database |
610 |
| Clearing the Zone Server Database |
610 |
| Advanced Zone Attributes |
610 |
| About Zone-Based Traffic Priority |
611 |
| Configuring Zone-Based Traffic Priority |
611 |
| Configuring Default Zone QoS Priority Attributes |
612 |
| Configuring the Default Zone Policy |
613 |
| About Broadcast Zoning |
613 |
| Configuring Broadcast Zoning |
614 |
| About LUN Zoning |
614 |
| Configuring a LUN-Based Zone |
615 |
| Assigning LUNs to Storage Subsystems |
616 |
| About Read-Only Zones |
616 |
| Configuring Read-Only Zones |
617 |
| Displaying Zone Information |
617 |
| Enhanced Zoning |
618 |
| About Enhanced Zoning |
618 |
| Changing from Basic Zoning to Enhanced Zoning |
619 |
| Changing from Enhanced Zoning to Basic Zoning |
619 |
| Enabling Enhanced Zoning |
620 |
| Creating Attribute Groups |
620 |
| Merging the Database |
620 |
| Analyzing a Zone Merge |
621 |
| Configuring Zone Merge Control Policies |
622 |
| Compacting the Zone Database for Downgrading |
622 |
| Default Settings |
623 |
| Distributing Device Alias Services |
625 |
| About Device Aliases |
625 |
| Device Alias Features |
625 |
| Device Alias Requirements |
626 |
| Zone Aliases Versus Device Aliases |
626 |
| Device Alias Databases |
626 |
| About Device Alias Distribution |
627 |
| Distributing the Device Alias Database |
627 |
| About Creating a Device Alias |
628 |
| Creating a Device Alias |
628 |
| Committing Changes |
629 |
| Discarding Changes |
629 |
| Legacy Zone Alias Conversion |
629 |
| Using Device Aliases or FC Aliases |
630 |
| Device Alias Statistics Cleanup |
630 |
| Database Merge Guidelines |
631 |
| Default Settings |
632 |
| Configuring Fibre Channel Routing Services and Protocols |
633 |
| About FSPF |
634 |
| FSPF Examples |
634 |
| Fault Tolerant Fabric |
634 |
| Redundant Links |
635 |
| Fail-Over Scenarios for PortChannels and FSPF Links |
635 |
| FSPF Global Configuration |
636 |
| About SPF Computational Hold Times |
636 |
| About Link State Records |
636 |
| Configuring FSPF on a VSAN |
637 |
| Resetting FSPF to the Default Configuration |
637 |
| Enabling or Disabling FSPF |
638 |
| FSPF Interface Configuration |
638 |
| About FSPF Link Cost |
638 |
| Configuring FSPF Link Cost |
639 |
| About Hello Time Intervals |
639 |
| Configuring Hello Time Intervals |
640 |
| About Dead Time Intervals |
640 |
| Configuring Dead Time Intervals |
640 |
| About Retransmitting Intervals |
640 |
| Configuring Retransmitting Intervals |
641 |
| About Disabling FSPF for Specific Interfaces |
641 |
| Disabling FSPF for Specific Interfaces |
641 |
| Displaying the FSPF Database |
642 |
| Viewing FSPF Statistics |
643 |
| FSPF Routes |
644 |
| About Fibre Channel Routes |
644 |
| Configuring Fibre Channel Routes |
644 |
| About Broadcast and Multicast Routing |
646 |
| About Multicast Root Switch |
646 |
| Setting the Multicast Root Switch |
646 |
| In-Order Delivery |
647 |
| About Reordering Network Frames |
647 |
| About Reordering PortChannel Frames |
649 |
| About Enabling In-Order Delivery |
649 |
| Enabling In-Order Delivery Globally |
650 |
| Enabling In-Order Delivery for a VSAN |
650 |
| Configuring the Drop Latency Time |
650 |
| Default Settings |
651 |
| Dense Wavelength Division Multiplexing |
653 |
| About DWDM |
653 |
| Viewing DWDM Links |
653 |
| Managing FLOGI, Name Server, FDMI, and RSCN Databases |
657 |
| FLOGI |
657 |
| Displaying FLOGI Details |
657 |
| Name Server Proxy |
658 |
| About Registering Name Server Proxies |
658 |
| Registering Name Server Proxies |
658 |
| About Rejecting Duplicate pWWN |
659 |
| Rejecting Duplicate pWWNs |
659 |
| To reject duplicate pWWNs, refer to the Cisco MDS 9000 Family CLI Configuration Guide. About Name Server Database Entries |
659 |
| Viewing Name Server Database Entries |
659 |
| FDMI |
660 |
| Displaying FDMI |
660 |
| RSCN |
661 |
| About RSCN Information |
661 |
| Displaying RSCN Information |
661 |
| About the multi-pid Option |
662 |
| Configuring the multi-pid Option |
662 |
| Clearing RSCN Statistics |
663 |
| RSCN Timer Configuration Distribution Using CFS |
663 |
| Configuring the RSCN Timer with CFS |
664 |
| Default Settings |
664 |
| Discovering SCSI Targets |
667 |
| About SCSI LUN Discovery |
667 |
| About Starting SCSI LUN Discovery |
667 |
| Starting SCSI LUN Discovery |
668 |
| About Initiating Customized Discovery |
668 |
| Initiating Customized Discovery |
668 |
| Displaying SCSI LUN Information |
669 |
| Configuring FICON |
671 |
| About FICON |
671 |
| FICON Requirements |
672 |
| MDS-Specific FICON Advantages |
673 |
| Fabric Optimization with VSANs |
673 |
| FCIP Support |
675 |
| PortChannel Support |
675 |
| VSANs for FICON and FCP Mixing |
675 |
| Cisco MDS-Supported FICON Features |
675 |
| FICON Cascading |
677 |
| FICON VSAN Prerequisites |
677 |
| FICON Port Numbering |
678 |
| Default FICON Port Numbering Scheme |
678 |
| Port Addresses |
681 |
| Implemented and Unimplemented Port Addresses |
681 |
| About the Reserved FICON Port Numbering Scheme |
681 |
| Installed and Uninstalled Ports |
682 |
| FICON Port Numbering Guidelines |
682 |
| Assigning FICON Port Numbers to Slots |
683 |
| About Port Numbers for FCIP and PortChannel |
683 |
| Reserving FICON Port Numbers for FCIP and PortChannel Interfaces |
683 |
| FC ID Allocation |
684 |
| Configuring FICON |
685 |
| About Enabling FICON on a VSAN |
685 |
| Setting Up a Basic FICON Configuration |
686 |
| Manually Enabling FICON on a VSAN |
688 |
| Deleting FICON VSANs |
688 |
| Suspending a FICON VSAN |
689 |
| Configuring the code-page Option |
689 |
| Assigning FC ID Last Byte |
690 |
| Allowing the Host to Move the Switch Offline |
691 |
| Allowing the Host to Change FICON Port Parameters |
692 |
| Allowing the Host to Control the Timestamp |
692 |
| Configuring SNMP Control of FICON Parameters |
692 |
| FICON Information Refresh Note |
693 |
| About FICON Device Allegiance |
693 |
| Automatically Saving the Running Configuration |
693 |
| Configuring FICON Ports |
694 |
| Configuring Port Blocking |
695 |
| Viewing ESCON Style Ports |
696 |
| Port Prohibiting |
696 |
| Configuring Port Prohibiting |
696 |
| Assigning a Port Address Name |
697 |
| About RLIR |
697 |
| Displaying RLIR Information |
697 |
| FICON Configuration Files |
698 |
| About FICON Configuration Files |
699 |
| Applying the Saved Configuration Files to the Running Configuration |
699 |
| Editing FICON Configuration Files |
700 |
| Displaying FICON Configuration Files |
700 |
| Copying FICON Configuration Files |
701 |
| Port Swapping |
701 |
| About Port Swapping |
702 |
| Swapping Ports |
703 |
| FICON Tape Acceleration |
703 |
| Configuring FICON Tape Acceleration |
705 |
| CUP In-Band Management |
707 |
| Calculating FICON Flow Load Balance |
709 |
| Displaying FICON Information |
710 |
| Receiving FICON Alerts |
711 |
| Displaying FICON Port Address Information |
711 |
| Displaying IPL File Information |
711 |
| Viewing the History Buffer |
711 |
| Default Settings |
712 |
| Advanced Features and Concepts |
713 |
| Common Information Model |
713 |
| Fibre Channel Time Out Values |
714 |
| Timer Configuration Across All VSANs |
714 |
| Timer Configuration Per-VSAN |
715 |
| About fctimer Distribution |
716 |
| Enabling or Disabling fctimer Distribution |
716 |
| Database Merge Guidelines |
717 |
| World Wide Names |
717 |
| Displaying WWN Information |
718 |
| Link Initialization WWN Usage |
718 |
| Configuring a Secondary MAC Address |
718 |
| FC ID Allocation for HBAs |
719 |
| Default Company ID list |
719 |
| Verifying the Company ID Configuration |
720 |
| Switch Interoperability |
720 |
| About Interop Mode |
720 |
| Configuring Interop Mode 1 |
723 |
| Verifying Interoperating Status |
724 |
| Default Settings |
725 |
| Part 5 |
727 |
| Security |
727 |
| Configuring FIPS |
729 |
| Configuration Guidelines |
730 |
| Enabling FIPS Mode |
730 |
| FIPS Self-Tests |
731 |
| Configuring Users and Common Roles |
733 |
| Role-Based Authorization |
733 |
| About Roles |
734 |
| Configuring Roles and Profiles |
734 |
| Deleting Common Roles |
735 |
| About the VSAN Policy |
735 |
| Modifying the VSAN Policy |
736 |
| About Rules and Features for Each Role |
736 |
| Modifying Rules |
737 |
| Displaying Role-Based Information |
739 |
| Role Distributions |
739 |
| About Role Databases |
739 |
| Locking the Fabric |
740 |
| Committing the Changes |
740 |
| Discarding the Changes |
741 |
| Enabling Distribution |
741 |
| Clearing Sessions |
741 |
| Database Merge Guidelines |
742 |
| Displaying Roles When Distribution is Enabled |
742 |
| User Accounts |
742 |
| About Users |
743 |
| Configuring Users |
744 |
| Deleting a User |
746 |
| Displaying User Account Information |
746 |
| SSH Services |
746 |
| About SSH |
747 |
| About the SSH Server Key Pair |
747 |
| Generating the SSH Server Key Pair |
748 |
| Overwriting a Generated Key Pair |
749 |
| Enabling SSH or Telnet Service |
749 |
| SSH Authentication Using Digital Certificates |
750 |
| Creating or Updating Users |
750 |
| Recovering the Administrator Password |
751 |
| Configuring Cisco ACS Servers |
752 |
| Default Settings |
755 |
| Configuring SNMP |
757 |
| About SNMP Security |
757 |
| SNMP Version 1 and Version 2c |
758 |
| SNMP Version 3 |
758 |
| Assigning SNMP Switch Contact and Location Information |
758 |
| SNMPv3 CLI User Management and AAA Integration |
758 |
| CLI and SNMP User Synchronization |
759 |
| Restricting Switch Access |
759 |
| Group-Based SNMP Access |
759 |
| Creating and Modifying Users |
760 |
| About AES Encryption-Based Privacy |
760 |
| Enforcing SNMPv3 Message Encryption |
761 |
| Assigning SNMPv3 Users to Multiple Roles |
762 |
| Adding Communities |
763 |
| Deleting a Community String |
763 |
| SNMP Trap and Inform Notifications |
764 |
| Configuring SNMPv2c Notifications |
764 |
| Configuring SNMPv3 Notifications |
765 |
| Enabling SNMP Notifications |
765 |
| Configuring the Notification Target User |
767 |
| Configuring Event Security |
767 |
| Viewing the SNMP Events Log |
767 |
| Default Settings |
768 |
| Configuring RADIUS and TACACS+ |
769 |
| Switch Management Security |
769 |
| Fabric Manager Security Options |
770 |
| SNMP Security Options |
770 |
| Switch AAA |
770 |
| Authentication |
771 |
| Authorization |
771 |
| Accounting |
771 |
| Remote AAA Services |
772 |
| Remote Authentication Guidelines |
772 |
| Server Groups |
772 |
| AAA Configuration Options |
772 |
| AAA Server Monitoring |
773 |
| Authentication and Authorization Process |
774 |
| Configuring RADIUS Server Monitoring Parameters |
775 |
| About RADIUS Server Default Configuration |
776 |
| About the Default RADIUS Server Encryption Type and Preshared Key |
776 |
| Configuring the Default RADIUS Server Encryption Type and Preshared Key |
776 |
| Setting the Default RADIUS Server Timeout Interval and Retransmits |
777 |
| About RADIUS Servers |
777 |
| Configuring a RADIUS Server |
778 |
| Configuring the Test Idle Timer |
779 |
| Configuring Test User Name |
779 |
| About Validating a RADIUS Server |
779 |
| Periodically Validating a RADIUS Server |
779 |
| Displaying RADIUS Server Statistics |
780 |
| About Users Specifying a RADIUS Server at Login |
780 |
| Allowing Users to Specify a RADIUS Server at Login |
780 |
| About Vendor-Specific Attributes |
781 |
| VSA Format |
781 |
| Specifying SNMPv3 on AAA Servers |
781 |
| Configuring TACACS+ Server Monitoring Parameters |
782 |
| About TACACS+ |
782 |
| About TACACS+ Server Default Configuration |
782 |
| About the Default TACACS+ Server Encryption Type and Preshared Key |
783 |
| Setting the Default TACACS+ Server Encryption Type and Preshared Key |
783 |
| Setting the Default TACACS+ Server Timeout Interval and Retransmits |
783 |
| About TACACS+ Servers |
784 |
| Configuring a TACACS+ Server |
784 |
| About Validating a TACACS+ Server |
785 |
| Periodically Validating a TACACS+ Server |
786 |
| Displaying TACACS+ Server Statistics |
786 |
| About Users Specifying a TACACS+ Server at Login |
786 |
| Allowing Users to Specify a TACACS+ Server at Login |
786 |
| About Custom Attributes for Roles |
787 |
| Supported TACACS+ Servers |
787 |
| Server Groups |
787 |
| About Configuring Server Groups |
788 |
| Configuring Server Groups |
788 |
| About Bypassing a Nonresponsive Server |
789 |
| AAA Server Distribution |
789 |
| Enabling AAA Server Distribution |
790 |
| Starting a Distribution Session on a Switch |
790 |
| Displaying the Session Status |
791 |
| Displaying the Configuration to be Distributed |
791 |
| Committing the Distribution |
791 |
| Discarding the Distribution Session |
791 |
| Clearing Sessions |
792 |
| Merge Guidelines for RADIUS and TACACS+ Configurations |
792 |
| MSCHAP Authentication |
792 |
| About Enabling MSCHAP |
793 |
| Enabling MSCHAP Authentication |
793 |
| Local AAA Services |
794 |
| Configuring Cisco Access Control Servers |
794 |
| Default Settings |
798 |
| Configuring IPv4 and IPv6 Access Control Lists |
801 |
| IPv4-ACL and IPv6-ACL Configuration Guidelines |
802 |
| About Filter Contents |
802 |
| Protocol Information |
802 |
| Address Information |
803 |
| Port Information |
803 |
| ICMP Information |
804 |
| TOS Information |
804 |
| Creating IPv4-ACLs or IPv6-ACLs with the IP-ACL Wizard |
805 |
| Creating IPv4-ACLs or IPv6-ACLs in Device Manager |
806 |
| Removing IP Filters from an Existing IPv4-ACL or IPv6-ACL |
808 |
| Deleting IP-ACLs |
808 |
| Reading the IP-ACL Log Dump |
808 |
| Applying an IP-ACL to an Interface |
809 |
| Example IP-ACL Configuration |
811 |
| Configuring Certificate Authorities and Digital Certificates |
813 |
| About CAs and Digital Certificates |
813 |
| Purpose of CAs and Digital Certificates |
814 |
| Trust Model, Trust Points, and Identity CAs |
814 |
| RSA Key-Pairs and Identity Certificates |
814 |
| Multiple Trusted CA Support |
815 |
| PKI Enrollment Support |
816 |
| Manual Enrollment Using Cut-and-Paste Method |
816 |
| Multiple RSA Key-Pair and Identity CA Support |
816 |
| Peer Certificate Verification |
817 |
| CRL Downloading, Caching, and Checking Support |
817 |
| OCSP Support |
817 |
| Import and Export Support for Certificates and Associated Key Pairs |
817 |
| Configuring CAs and Digital Certificates |
818 |
| Configuring the Host Name and IP Domain Name |
818 |
| Generating an RSA Key-Pair |
818 |
| Creating a Trust Point CA Association |
820 |
| Copying Files to Bootflash |
821 |
| Authenticating the CA |
822 |
| Confirming CA Authentication |
823 |
| Configuring Certificate Revocation Checking Methods |
824 |
| Generating Certificate Requests |
824 |
| Installing Identity Certificates |
825 |
| Saving Your Configuration |
825 |
| Ensuring Trust Point Configurations Persist Across Reboots |
826 |
| Monitoring and Maintaining CA and Certificates Configuration |
826 |
| Exporting and Importing Identity Information in PKCS#12 Format |
826 |
| Configuring a CRL |
827 |
| Deleting Certificates from the CA Configuration |
828 |
| Deleting RSA Key-Pairs from Your Switch |
828 |
| Example Configurations |
829 |
| Configuring Certificates on the MDS Switch |
829 |
| Downloading a CA Certificate |
831 |
| Requesting an Identity Certificate |
836 |
| Revoking a Certificate |
842 |
| Generating and Publishing the CRL |
845 |
| Downloading the CRL |
846 |
| Importingthe CRL |
848 |
| Maximum Limits |
848 |
| Default Settings |
849 |
| Configuring IPsec Network Security |
851 |
| About IPsec |
852 |
| About IKE |
853 |
| IPsec Prerequisites |
853 |
| Using IPsec |
854 |
| IPsec Compatibility |
854 |
| IPsec and IKE Terminology |
855 |
| Supported IPsec Transforms and Algorithms |
856 |
| Supported IKE Transforms and Algorithms |
856 |
| IPsec Digital Certificate Support |
857 |
| Implementing IPsec Without CAs and Digital Certificates |
857 |
| Implementing IPsec with CAs and Digital Certificates |
858 |
| How CA Certificates Are Used by IPsec Devices |
859 |
| Configuring IPsec Using FCIP Wizard |
860 |
| Manually Configuring IPsec and IKE |
863 |
| About IKE Initialization |
863 |
| About the IKE Domain |
863 |
| About IKE Tunnels |
863 |
| About IKE Policy Negotiation |
864 |
| Configuring an IKE Policy |
865 |
| Optional IKE Parameter Configuration |
866 |
| Configuring the Keepalive Time for a Peer |
867 |
| Configuring the Initiator Version |
868 |
| Clearing IKE Tunnels or Domains |
870 |
| Refreshing SAs |
870 |
| Crypto IPv4-ACLs |
871 |
| About Crypto IPv4-ACLs |
872 |
| Crypto IPv4-ACL Guidelines |
872 |
| Mirror Image Crypto IPv4-ACLs |
874 |
| The any Keyword in Crypto IPv4-ACLs |
875 |
| Creating Crypto IPv4-ACLs |
875 |
| About Transform Sets in IPsec |
875 |
| Configuring Transform Sets |
876 |
| About Crypto Map Entries |
878 |
| SA Establishment Between Peers |
878 |
| Crypto Map Configuration Guidelines |
879 |
| Creating Crypto Map Entries |
879 |
| About SA Lifetime Negotiation |
880 |
| Setting the SA Lifetime |
881 |
| About the AutoPeer Option |
882 |
| Configuring the AutoPeer Option |
883 |
| About Perfect Forward Secrecy |
884 |
| Configuring Perfect Forward Secrecy |
885 |
| About Crypto Map Set Application |
886 |
| Applying a Crypto Map Set |
886 |
| IPsec Maintenance |
887 |
| Global Lifetime Values |
887 |
| Default Settings |
889 |
| Configuring FC-SP and DHCHAP |
891 |
| About Fabric Authentication |
891 |
| DHCHAP |
892 |
| DHCHAP Compatibility with Existing Cisco MDS Features |
893 |
| About Enabling DHCHAP |
894 |
| Enabling DHCHAP |
894 |
| About DHCHAP Authentication Modes |
895 |
| Configuring the DHCHAP Mode |
895 |
| About the DHCHAP Hash Algorithm |
896 |
| Configuring the DHCHAP Hash Algorithm |
896 |
| About the DHCHAP Group Settings |
897 |
| Configuring the DHCHAP Group Settings |
897 |
| About the DHCHAP Password |
897 |
| Configuring DHCHAP Passwords for the Local Switch |
898 |
| About Password Configuration for Remote Devices |
898 |
| Configuring DHCHAP Passwords for Remote Devices |
898 |
| About the DHCHAP Timeout Value |
899 |
| Configuring the DHCHAP Timeout Value |
899 |
| Configuring DHCHAP AAA Authentication |
900 |
| Enabling FC-SP on ISLs |
900 |
| Default Settings |
900 |
| Configuring Port Security |
901 |
| About Port Security |
901 |
| Port Security Enforcement |
902 |
| About Auto-Learning |
902 |
| Port Security Activation |
903 |
| Port Security Configuration Guidelines |
903 |
| Configuring Port Security with Auto-Learning and CFS Distribution |
903 |
| Configuring Port Security with Auto-Learning without CFS |
904 |
| Configuring Port Security with Manual Database Configuration |
904 |
| Configuring Port Security Using Wizard |
905 |
| Prerequisites |
905 |
| Enabling Port Security |
909 |
| Port Security Activation |
910 |
| Activating Port Security |
910 |
| Database Activation Rejection |
911 |
| Forcing Port Security Activation |
911 |
| Database Reactivation |
912 |
| Copying an Active Database to the Config Database |
912 |
| Displaying Activated Port Security Settings |
913 |
| Displaying Port Security Statistics |
913 |
| Displaying Port Security Violations |
913 |
| Displaying Port Security Violations |
913 |
| Auto-learning |
914 |
| About Enabling Auto-learning |
914 |
| Enabling Auto-learning |
914 |
| Disabling Auto-learning |
915 |
| Auto-Learning Device Authorization |
915 |
| Authorization Scenarios |
916 |
| Port Security Manual Configuration |
917 |
| About WWN Identification |
917 |
| Adding Authorized Port Pairs |
918 |
| Deleting Port Security Setting |
918 |
| Port Security Configuration Distribution |
919 |
| Enabling Distribution |
919 |
| Locking The Fabric |
920 |
| Committing the Changes |
920 |
| Activation and Auto-learning Configuration Distribution |
920 |
| Database Merge Guidelines |
921 |
| Database Interaction |
922 |
| Database Scenarios |
922 |
| Port Security Database Copy |
923 |
| Port Security Database Deletion |
924 |
| Port Security Database Cleanup |
924 |
| Default Settings |
925 |
| Configuring Fabric Binding |
927 |
| About Fabric Binding |
927 |
| Licensing Requirements |
927 |
| Port Security Versus Fabric Binding |
927 |
| Fabric Binding Enforcement |
928 |
| Fabric Binding Configuration |
929 |
| Enabling Fabric Binding |
929 |
| Configuring Switch WWN List |
929 |
| Fabric Binding Activation |
930 |
| Forcing Fabric Binding Activation |
931 |
| Saving Fabric Binding Configurations |
931 |
| Clearing the Fabric Binding Statistics |
932 |
| Deleting the Fabric Binding Database |
932 |
| Verifying Fabric Binding Configurations |
932 |
| Default Settings |
935 |
| Part 6 |
937 |
| IP Services |
937 |
| Configuring FCIP |
939 |
| About FCIP |
939 |
| FCIP Concepts |
940 |
| FCIP and VE Ports |
940 |
| FCIP Links |
941 |
| FCIP Profiles |
942 |
| FCIP Interfaces |
942 |
| FCIP High-Availability Solutions |
942 |
| Fibre Channel PortChannels |
943 |
| FSPF |
943 |
| VRRP |
944 |
| Ethernet PortChannels |
944 |
| Ethernet PortChannels and Fibre Channel PortChannels |
945 |
| Configuring FCIP |
945 |
| Enabling FCIP |
946 |
| Using the FCIP Wizard |
946 |
| Basic FCIP Configuration |
953 |
| Creating FCIP Profiles |
954 |
| Creating FCIP Links |
954 |
| Verifying Interfaces and Extended Link Protocol |
955 |
| Checking Trunk Status |
955 |
| Launching Cisco Transport Controller |
956 |
| Launching Cisco Transport Controller |
956 |
| Advanced FCIP Profile Configuration |
956 |
| Configuring TCP Parameters |
957 |
| Minimum Retransmit Timeout |
957 |
| Keepalive Timeout |
957 |
| Maximum Retransmissions |
957 |
| Path MTUs |
958 |
| Selective Acknowledgments |
958 |
| Window Management |
958 |
| Monitoring Congestion |
958 |
| Estimating Maximum Jitter |
959 |
| Buffer Size |
959 |
| Advanced FCIP Interface Configuration |
959 |
| Configuring Peers |
960 |
| Peer IP Address |
960 |
| Special Frames |
962 |
| Active Connections |
963 |
| Number of TCP Connections |
963 |
| Time Stamp Control |
963 |
| FCIP B Port Interoperability Mode |
963 |
| Configuring B Ports |
965 |
| Quality of Service |
966 |
| Configuring E Ports |
966 |
| Advanced FCIP Features |
967 |
| FCIP Write Acceleration |
967 |
| Configuring FCIP Write Acceleration |
969 |
| FCIP Tape Acceleration |
970 |
| Tape Library LUN Mapping for FCIP Tape Acceleration |
973 |
| Configuring FCIP Tape Acceleration |
974 |
| FCIP Compression |
975 |
| Default Settings |
976 |
| Configuring the SAN Extension Tuner |
979 |
| About the SAN Extension Tuner |
979 |
| SAN Extension Tuner Setup |
980 |
| Data Pattern |
981 |
| License Prerequisites |
981 |
| Configuring the SAN Extension Tuner |
981 |
| Tuning Guidelines |
982 |
| Using the SAN Extension Tuner Wizard |
982 |
| Default Settings |
984 |
| Configuring iSCSI |
987 |
| About iSCSI |
987 |
| About iSCSI Configuration Limits |
990 |
| Configuring iSCSI |
990 |
| Enabling iSCSI |
990 |
| Creating iSCSI Interfaces |
991 |
| Using the iSCSI Wizard |
991 |
| Presenting Fibre Channel Targets as iSCSI Targets |
993 |
| Dynamic Mapping |
994 |
| Static Mapping |
996 |
| Advertising Static iSCSI Targets |
998 |
| iSCSI Virtual Target Configuration Examples |
998 |
| Example 1 |
998 |
| Example 2 |
998 |
| Example 3 |
999 |
| Presenting iSCSI Hosts as Virtual Fibre Channel Hosts |
1000 |
| Initiator Identification |
1000 |
| Initiator Presentation Modes |
1000 |
| Transparent Initiator Mode |
1001 |
| iSCSI Initiator Idle Timeout |
1002 |
| WWN Assignment for iSCSI Initiators |
1003 |
| Proxy- Initiator Mode |
1006 |
| VSAN Membership for iSCSI |
1008 |
| VSAN Membership for iSCSI Hosts |
1008 |
| VSAN Membership for iSCSI Interfaces |
1009 |
| Example of VSAN Membership for iSCSI Devices |
1009 |
| Advanced VSAN Membership for iSCSI Hosts |
1010 |
| iSCSI Access Control |
1010 |
| Fibre Channel Zoning-Based Access Control |
1011 |
| iSCSI-Based Access Control |
1012 |
| Enforcing Access Control |
1013 |
| iSCSI Session Authentication |
1014 |
| Authentication Mechanism |
1015 |
| Local Authentication |
1016 |
| Restricting iSCSI Initiator Authentication |
1016 |
| Mutual CHAP Authentication |
1016 |
| Configuring an iSCSI RADIUS Server |
1017 |
| iSCSI Immediate Data and Unsolicited Data Features |
1017 |
| iSCSI Interface Advanced Features |
1018 |
| iSCSI Listener Port |
1018 |
| TCP Tuning Parameters |
1018 |
| QoS |
1018 |
| iSCSI Routing Modes |
1019 |
| Configuring iSLB |
1021 |
| About iSLB Configuration Limits |
1022 |
| iSLB Configuration Prerequisites |
1023 |
| About iSLB Initiators |
1023 |
| Configuring iSLB using Device Manager |
1023 |
| Configuring iSLB Initiators |
1025 |
| Assigning WWNs to iSLB Initiators |
1026 |
| Making the Dynamic iSLB Initiator WWN Mapping Static |
1026 |
| Assigning VSAN Membership for iSLB Initiators |
1026 |
| Configuring Metric for Load Balancing |
1027 |
| Configuring iSLB Initiator Targets |
1027 |
| Configuring and Activating Zones for iSLB Initiators and Initiator Targets |
1028 |
| Configuring iSLB Session Authentication |
1029 |
| Restricting iSLB Initiator Authentication |
1029 |
| Mutual CHAP Authentication |
1029 |
| About Load Balancing Using VRRP |
1029 |
| Changing iSCSI Interface Parameters and the Impact on Load Balancing |
1031 |
| VRRP Load Balancing Algorithm For Selecting Gigabit Ethernet Interfaces |
1031 |
| Configuring Load Balancing Using VRRP |
1031 |
| About iSLB Configuration Distribution Using CFS |
1032 |
| Distributing the iSLB Configuration Using CFS |
1033 |
| Enabling iSLB Configuration Distribution |
1033 |
| Locking the Fabric |
1034 |
| Committing Changes to the Fabric |
1034 |
| Discarding Pending Changes |
1034 |
| Clearing a Fabric Lock |
1034 |
| CFS Merge Process |
1035 |
| iSLB CFS Merge Status Conflicts |
1035 |
| iSCSI High Availability |
1036 |
| Transparent Target Failover |
1036 |
| iSCSI High Availability with Host Running Multi-Path Software |
1036 |
| iSCSI HA with Host Not Having Any Multi-Path Software |
1037 |
| LUN Trespass for Storage Port Failover |
1039 |
| Multiple IPS Ports Connected to the Same IP Network |
1039 |
| VRRP-Based High Availability |
1040 |
| Ethernet PortChannel-Based High Availability |
1041 |
| iSCSI Authentication Setup Guidelines and Scenarios |
1042 |
| No Authentication |
1042 |
| CHAP with Local Password Database |
1043 |
| CHAP with External RADIUS Server |
1043 |
| iSCSI Transparent Mode Initiator |
1044 |
| Target Storage Device Requiring LUN Mapping |
1048 |
| iSNS |
1053 |
| About iSNS Client Functionality |
1053 |
| Creating an iSNS Client Profile |
1054 |
| About iSNS Server Functionality |
1055 |
| Example Scenario |
1056 |
| Configuring iSNS Servers |
1057 |
| Enabling the iSNS Server |
1057 |
| iSNS Configuration Distribution |
1057 |
| Configuring the ESI Retry Count |
1058 |
| Configuring the Registration Period |
1058 |
| iSNS Client Registration and Deregistration |
1058 |
| Target Discovery |
1058 |
| iSNS Cloud Discovery |
1059 |
| About Cloud Discovery |
1059 |
| Configuring iSNS Cloud Discovery |
1060 |
| Enabling iSNS Cloud Discovery |
1060 |
| Initiating On-Demand iSNS Cloud Discovery |
1060 |
| Configuring Automatic iSNS Cloud Discovery |
1061 |
| Configuring iSNS Cloud Discovery Distribution |
1061 |
| Default Settings |
1061 |
| Configuring IP Services |
1063 |
| Traffic Management Services |
1064 |
| Management Interface Configuration |
1064 |
| Default Gateway |
1065 |
| About the Default Gateway |
1065 |
| Configuring the Default Gateway |
1065 |
| IPv4 Default Network Configuration |
1066 |
| IPFC |
1067 |
| IPFC Configuration Guidelines |
1067 |
| IPv4 Static Routes |
1067 |
| Overlay VSANs |
1068 |
| About Overlay VSANs |
1068 |
| Configuring Overlay VSANs |
1068 |
| Multiple VSAN Configuration |
1069 |
| Virtual Router Redundancy Protocol |
1070 |
| About VRRP |
1071 |
| Configuring VRRP |
1072 |
| Adding and Deleting Virtual Router |
1072 |
| Virtual Router Initiation |
1073 |
| Adding Virtual Router IP Addresses |
1073 |
| Priority for the Virtual Router |
1073 |
| Time Interval for Advertisement Packets |
1073 |
| Priority Preemption |
1073 |
| Virtual Router Authentication |
1074 |
| Priority Based on Interface State Tracking |
1074 |
| DNS Server Configuration |
1074 |
| Default Settings |
1075 |
| Configuring IP Storage |
1077 |
| Services Modules |
1077 |
| Module Status Verification |
1078 |
| IPS Module Upgrade |
1079 |
| MPS-14/2 Module Upgrade |
1079 |
| Supported Hardware |
1079 |
| Configuring Gigabit Ethernet Interfaces for IPv4 |
1080 |
| Basic Gigabit Ethernet Configuration |
1080 |
| Configuring Interface Descriptions |
1081 |
| Configuring Beacon Mode |
1081 |
| Configuring Autonegotiation |
1081 |
| Configuring the MTU Frame Size |
1081 |
| Configuring Promiscuous Mode |
1082 |
| About VLANs for Gigabit Ethernet |
1082 |
| Interface Subnet Requirements |
1082 |
| Verifying Gigabit Ethernet Connectivity |
1083 |
| Gigabit Ethernet IPv4-ACL Guidelines |
1083 |
| Configuring Gigabit Ethernet High Availability |
1084 |
| VRRP for iSCSI and FCIP Services |
1084 |
| Configuring VRRP for Gigabit Ethernet Interfaces |
1085 |
| About Ethernet PortChannel Aggregation |
1085 |
| Configuring Ethernet PortChannels |
1086 |
| Configuring CDP |
1086 |
| Default Settings |
1086 |
| Configuring IPv4 for Gigabit Ethernet Interfaces |
1089 |
| About IPv4 |
1089 |
| Basic Gigabit Ethernet Configuration for IPv4 |
1090 |
| Configuring Interface Descriptions |
1091 |
| Configuring Beacon Mode |
1091 |
| Configuring Autonegotiation |
1091 |
| Configuring the MTU Frame Size |
1091 |
| Configuring Promiscuous Mode |
1092 |
| VLANs |
1092 |
| About VLANs for Gigabit Ethernet |
1092 |
| Configuring the VLAN Subinterface |
1093 |
| Interface Subnet Requirements |
1093 |
| IPv4-ACLs |
1093 |
| Gigabit Ethernet IPv4-ACL Guidelines |
1094 |
| Default Settings |
1094 |
| Configuring IPv6 for Gigabit Ethernet Interfaces |
1095 |
| About IPv6 |
1095 |
| Extended IPv6 Address Space for Unique Addresses |
1096 |
| IPv6 Address Formats |
1096 |
| IPv6 Address Prefix Format |
1097 |
| IPv6 Address Type: Unicast |
1097 |
| Global Addresses |
1097 |
| Link-Local Address |
1098 |
| IPv6 Address Type: Multicast |
1099 |
| ICMP for IPv6 |
1100 |
| Path MTU Discovery for IPv6 |
1101 |
| IPv6 Neighbor Discovery |
1101 |
| IPv6 Neighbor Solicitation and Advertisement Messages |
1101 |
| Router Discovery |
1103 |
| IPv6 Stateless Autoconfiguration |
1103 |
| Dual IPv4 and IPv6 Protocol Stacks |
1104 |
| Configuring Basic Connectivity for IPv6 |
1105 |
| Configuring IPv6 Addressing and Enabling IPv6 Routing |
1105 |
| Configuring IPv4 and IPv6 Protocol Addresses |
1107 |
| Configuring IPv6 Static Routes |
1107 |
| Configuring a IPv6 Static Route |
1107 |
| Gigabit Ethernet IPv6-ACL Guidelines |
1108 |
| Transitioning from IPv4 to IPv6 |
1109 |
| Default Settings |
1109 |
| Part 7 |
1111 |
| Intelligent Storage Services |
1111 |
| Configuring SCSI Flow Services and Statistics |
1113 |
| SCSI Flow Services |
1113 |
| About SCSI Flow Services |
1113 |
| SCSI Flow Manager |
1114 |
| SCSI Flow Configuration Client |
1115 |
| SCSI Flow Data Path Support |
1115 |
| Configuring SCSI Flow Services |
1115 |
| Enabling Intelligent Storage Services |
1115 |
| Disabling Intelligent Storage Services |
1117 |
| SCSI Flow Statistics |
1118 |
| About SCSI Flow Statistics |
1118 |
| Configuring SCSI Flow Statistics |
1119 |
| Enabling SCSI Flow Statistics |
1119 |
| Clearing SCSI Flow Statistics |
1120 |
| Default Settings |
1120 |
| Configuring Fibre Channel Write Acceleration |
1121 |
| Fibre Channel Write Acceleration |
1121 |
| About Fibre Channel Write Acceleration |
1121 |
| Enabling Fibre Channel Write Acceleration |
1122 |
| Default Settings |
1123 |
| Configuring SANTap |
1125 |
| Default Settings, page 57-7About SANTap |
1125 |
| Configuring SANTap |
1127 |
| Enabling SANTap |
1127 |
| Creating a SANTap CVT |
1128 |
| Deleting a SANTap CVT |
1128 |
| Creating a SANTap DVT |
1129 |
| Deleting a SANTap DVT |
1130 |
| Default Settings |
1131 |
| Configuring NASB |
1133 |
| Intelligent Storage Services |
1133 |
| Enabling Intelligent Storage Services |
1134 |
| Disabling Intelligent Storage Services |
1135 |
| About NASB |
1135 |
| Configuring NASB |
1137 |
| Default Settings |
1138 |
| Part 8 |
1141 |
| Network and Switch Monitoring |
1141 |
| Network Monitoring |
1143 |
| SAN Discovery and Topology Mapping |
1143 |
| Device Discovery |
1143 |
| Topology Mapping |
1143 |
| Using the Topology Map |
1144 |
| Saving a Customized Topology Map Layout |
1144 |
| Using Enclosures with Fabric Manager Topology Maps |
1145 |
| Mapping Multiple Fabrics |
1145 |
| Inventory Management |
1145 |
| Using the Inventory Tab from Fabric Manager Web Server |
1145 |
| Viewing Logs from Device Manager |
1146 |
| Health and Event Monitoring |
1146 |
| Fabric Manager Events Tab |
1146 |
| Event Information in Fabric Manager Web Server Reports |
1146 |
| Events in Device Manager |
1146 |
| Performance Monitoring |
1147 |
| Real-Time Performance Monitoring |
1147 |
| Device Manager Real-Time Performance Monitoring |
1147 |
| Fabric Manager Real-Time ISL Statistics |
1149 |
| Historical Performance Monitoring |
1150 |
| Creating a Flow with Performance Manager |
1150 |
| Creating a Collection with Performance Manager |
1150 |
| Using Performance Thresholds |
1150 |
| Using the Performance Manager Configuration Wizard |
1151 |
| Viewing Performance Manager Reports |
1151 |
| Performance Summary |
1152 |
| Performance Tables and Details Graphs |
1152 |
| Viewing Performance of Host-Optimized Port Groups |
1152 |
| Viewing Performance Manager Events |
1152 |
| Generating Top10 Reports in Performance Manager |
1153 |
| Generating Top10 Reports Using Scripts |
1153 |
| Exporting Data Collections to XML Files |
1153 |
| Exporting Data Collections in Readable Format |
1154 |
| Configuring Performance Manager for Use with Cisco Traffic Analyzer |
1155 |
| Configuring RMON |
1159 |
| About RMON |
1159 |
| Configuring RMON Using Threshold Manager |
1159 |
| RMON Alarm Configuration |
1160 |
| Enabling RMON Alarms by Port |
1160 |
| Enabling RMON Alarms for VSANs |
1162 |
| Enabling RMON Alarms for Physical Components |
1164 |
| Managing RMON Events |
1165 |
| Managing RMON Alarms |
1166 |
| Viewing the RMON Log |
1166 |
| Default Settings |
1167 |
| Monitoring Network Traffic Using SPAN |
1169 |
| About SPAN |
1170 |
| SPAN Sources |
1170 |
| IPS Source Ports |
1171 |
| Allowed Source Interface Types |
1171 |
| VSAN as a Source |
1172 |
| Guidelines to Configure VSANs as a Source |
1172 |
| SPAN Sessions |
1173 |
| Specifying Filters |
1173 |
| Guidelines to Specifying Filters |
1173 |
| SD Port Characteristics |
1173 |
| Guidelines to Configure SPAN |
1174 |
| Configuring SPAN |
1174 |
| Configuring SPAN |
1174 |
| Creating SPAN Sessions |
1175 |
| Editing SPAN Sources |
1176 |
| Deleting SPAN Sessions |
1177 |
| SPAN Conversion Behavior |
1177 |
| Monitoring Traffic Using Fibre Channel Analyzers |
1178 |
| Without SPAN |
1178 |
| With SPAN |
1179 |
| Configuring Fibre Channel Analyzers Using SPAN |
1180 |
| Single SD Port to Monitor Traffic |
1180 |
| Default SPAN Settings |
1181 |
| Configuring System Message Logging |
1183 |
| About System Message Logging |
1183 |
| System Message Logging Configuration |
1185 |
| Message Logging Initiation |
1185 |
| Console Severity Level |
1186 |
| Module Logging |
1187 |
| Log Files |
1188 |
| System Message Logging Servers |
1189 |
| Verifying Syslog Servers from Fabric Manager Web Server |
1192 |
| Outgoing System Message Logging Server Facilities |
1192 |
| Viewing Logs from Fabric Manager Web Server |
1193 |
| Viewing Logs from Device Manager |
1193 |
| Default Settings |
1193 |
| Configuring Call Home |
1195 |
| Call Home Features |
1196 |
| Cisco AutoNotify |
1196 |
| Call Home Configuration Process |
1197 |
| Contact Information |
1197 |
| Destination Profiles |
1199 |
| Alert Groups |
1200 |
| Customized Alert Group Messages |
1201 |
| Call Home Message Level Feature |
1202 |
| Syslog-Based Alerts |
1203 |
| RMON-Based Alerts |
1204 |
| E-Mail Options |
1205 |
| Configuring General E-Mail Options |
1205 |
| Periodic Inventory Notification |
1205 |
| Duplicate Message Throttle |
1207 |
| Call Home Enable Function |
1207 |
| Call Home Configuration Distribution |
1208 |
| Fabric Lock Override |
1209 |
| Database Merge Guidelines |
1209 |
| Call Home Communications Test |
1210 |
| Configuring EMC Call Home |
1210 |
| Sample Syslog Alert Notification in Full-txt Format |
1211 |
| Sample Syslog Alert Notification in XML Format |
1211 |
| Sample RMON Notification in XML Format |
1212 |
| Default Settings |
1213 |
| Event Triggers |
1214 |
| Call Home Message Levels |
1216 |
| Message Contents |
1217 |
| Configuring Fabric Configuration Servers |
1225 |
| About FCS |
1225 |
| Significance of FCS |
1226 |
| Displaying FCS Discovery |
1227 |
| Displaying FCS Elements |
1227 |
| Creating an FCS Platform |
1228 |
| Displaying FCS Fabric Ports |
1229 |
| Default Settings |
1230 |
| Part 9 |
1231 |
| Traffic Management |
1231 |
| Configuring Fabric Congestion Control and QoS |
1233 |
| FCC |
1233 |
| About FCC |
1233 |
| FCC Process |
1234 |
| Enabling FCC |
1234 |
| Assigning FCC Priority |
1235 |
| QoS |
1235 |
| About Control Traffic |
1235 |
| Enabling or Disabling Control Traffic |
1236 |
| About Data Traffic |
1236 |
| VSAN Versus Zone-Based QoS |
1237 |
| Configuring Data Traffic |
1238 |
| About Class Map Creation |
1238 |
| Creating a Class Map |
1239 |
| About Service Policy Definition |
1240 |
| About Service Policy Enforcement |
1240 |
| About the DWRR Traffic Scheduler Queue |
1240 |
| Changing the Weight in a DWRR Queue |
1241 |
| Example Configuration |
1242 |
| Ingress Port Rate Limiting |
1243 |
| Default Settings |
1244 |
| Configuring Port Tracking |
1245 |
| About Port Tracking |
1245 |
| Port Tracking |
1246 |
| About Port Tracking |
1246 |
| Enabling Port Tracking |
1247 |
| About Configuring Linked Ports |
1247 |
| Operationally Binding a Tracked Port |
1247 |
| About Tracking Multiple Ports |
1249 |
| Tracking Multiple Ports |
1249 |
| About Monitoring Ports in a VSAN |
1250 |
| Monitoring Ports in a VSAN |
1250 |
| About Forceful Shutdown |
1250 |
| Forcefully Shutting Down a Tracked Port |
1250 |
| Default Port Tracking Settings |
1250 |
| Part 10 |
1251 |
| Troubleshooting |
1251 |
| Troubleshooting Your Fabric |
1253 |
| Troubleshooting Tools and Techniques |
1253 |
| Cisco Traffic Analyzer |
1254 |
| Cisco Protocol Analyzer |
1255 |
| Analyzing Switch Device Health |
1255 |
| Analyzing Switch Fabric Configuration |
1256 |
| Analyzing End-to-End Connectivity |
1257 |
| Using the Ping Tool (fcping) |
1259 |
| Using Traceroute (fctrace) and Other Troubleshooting Tools |
1259 |
| Analyzing the Results of Merging Zones |
1260 |
| Issuing the Show Tech Support Command |
1261 |
| Running CLI Commands |
1263 |
| Running CLI Commands |
1263 |
| Adjusting for Daylight Savings Time |
1264 |
| Locating Other Switches |
1264 |
| Getting Oversubscription Information in Device Manager |
1266 |
| Fibre Channel Time Out Values |
1266 |
| Timer Configuration Across All VSANs |
1267 |
| Timer Configuration Per-VSAN |
1268 |
| Configuring a Fabric Analyzer |
1269 |
| About the Cisco Fabric Analyzer |
1269 |
| Local Text-Based Capture |
1270 |
| Remote Capture Daemon |
1270 |
| GUI-Based Client |
1271 |
| Configuring the Cisco Fabric Analyzer |
1271 |
| Sending Captures to Remote IP Addresses |
1272 |
| Displaying Captured Frames |
1272 |
| Defining Display Filters |
1273 |
| Capture Filters |
1273 |
| Permitted Capture Filters |
1274 |
| Configuring World Wide Names |
1275 |
| Link Initialization WWN Usage |
1275 |
| Configuring a Secondary MAC Address |
1275 |
| Displaying WWN Information |
1276 |
| FC ID Allocation for HBAs |
1276 |
| Default Settings |
1277 |
| Management Software FAQ |
1279 |
| Installation Issues |
1281 |
| When installing Fabric Manager from windows, why does clicking install fail? |
1281 |
| Why do I have trouble launching Fabric Manager on Solaris? |
1281 |
| What do I do if my browser prompts to save JNLP files? |
1281 |
| What do I do if I see a \ |
1282 |
| What do I do if my desktop shortcuts not visible? |
1282 |
| How do I upgrade to a newer version of Fabric Manager or Device Manager? |
1282 |
| How do I downgrade Fabric Manager or Device Manager? |
1282 |
| What do I do if an upgrade is not working? |
1282 |
| What do I do if Java Web Start hangs on the download dialog? |
1283 |
| How do I manually configure a browser for Java Web Start? |
1283 |
| How do I run Java Web Start from the command line? |
1283 |
| How do I clear the Java Web Start cache? |
1284 |
| What do I do if during a Fabric Manager upgrade, the installer doesn’t display a prompt to create a shortcut? |
1284 |
| What do I do if my login does not work in Fabric Manager or Device Manager? |
1284 |
| What do I do if I cannot install Fabric Manager or Device Manager, or run Java, when pcAnyWhere is running? |
1284 |
| What do I do if the Fabric Manager or Performance Manager service shows up as “disabled” in the Services menu? |
1284 |
| What do I do if I am unable to install Fabric Manager or Device Manager, or run Java, when McAfee Internet Suite 6.0 Professional is running? |
1285 |
| General |
1285 |
| What do I do if I see errors while monitoring Area chart graphing? |
1285 |
| What do I do if I see \ |
1285 |
| What do I do if disk images in the Device Manager Summary View are not visible? |
1285 |
| What do I do if I am unable to set both the D_S_TOV and E_D_TOV timers in Device Manager? |
1285 |
| What do I do if columns in Device Manager tables are too small? |
1286 |
| What do I do if fabric changes are not propagated onto the map (for example, links don't disappear)? |
1286 |
| What do I do if the PortChannel creation dialog becomes too small after several uses? |
1286 |
| What do I do if I see errors after IPFC configuration? |
1286 |
| What do I do if Fabric Manager or Device Manager is using the wrong network interface? |
1286 |
| What do I do if I see display anomalies in Fabric Manager or Device Manager? |
1286 |
| What do I do if most of my Physical Attributes catagories disappear? |
1287 |
| What do I do if I can’t see the Information pane? |
1287 |
| Why is the active zone set in edit zone always shown in bold (even after successful activation)? |
1287 |
| Can I create a zone with prefix IVRZ or a zone set with name nozonset? |
1287 |
| What do I do when One-Click License Install fails, and I cannot connect to the Cisco website? |
1287 |
| What do I do when Fabric Manager client and Device Manager cannot connect to the switch? |
1288 |
| How do I increase the log window size in Fabric Manager Client? |
1288 |
| When do I do when the FM Server Database fails to start or has a file locking error? |
1288 |
| Windows Issues |
1288 |
| What do I do when text fields show up too small, and I cannot enter any data? |
1288 |
| What do I do when printing causes an application crash? |
1288 |
| What do I do when Windows XP hangs (or I see a blue screen)? |
1288 |
| What do I do when Fabric Manager and Device Manager Icons Disappear? |
1289 |
| What do I do when Device Manager or Fabric Manager window content disappears in Windows XP? |
1289 |
| What do I do when SCP/SFTP fails when a file is copied from local machine to the switch? |
1289 |
| UNIX Issues |
1289 |
| What do I do when the parent Menus Disappear? |
1289 |
| What do I do when the web browser cannot find web server even it is running? |
1289 |
| How do I fix a \ |
1289 |
| Other |
1290 |
| How do I set the map layout so it stays after Fabric Manager restarted? |
1290 |
| What do I do when two switches show on the map, but there is only one switch? |
1290 |
| What does a red/orange/dotted line through the switch mean? |
1291 |
| How do I upgrade without losing map settings? |
1296 |
| How do I preserve historical data when moving Fabric Manager server to new host? |
1296 |
| Are there restrictions when using Fabric Manager across FCIP? |
1297 |
| How do I fix a \ |
1297 |
| How do I run Cisco Fabric Manager with multiple interfaces? |
1297 |
| Manually specifying an interface for Fabric Manager Server |
1298 |
| Manually specifying an interface for Fabric Manager Client or Device Manager |
1298 |
| How do I configure an HTTP proxy server? |
1298 |
| How do I clear the topology map? |
1299 |
| How can I use Fabric Manager in a mixed software environment? |
1299 |
| How do I fix a \ |
1299 |
| How do I search for Devices in a Fabric? |
1300 |
| How does Fabric Manager Server licensing work? |
1301 |
| How do I manage Multiple Fabrics? |
1301 |
| How can I clear an Orange X Through a Switch caused by license expiration? |
1301 |
| Monitoring System Processes and Logs |
1303 |
| Displaying System Processes |
1303 |
| Displaying System Status |
1304 |
| Core and Log Files |
1305 |
| Displaying Core Status |
1305 |
| Clearing the Core Directory |
1306 |
| First and Last Core |
1306 |
| First and Last Core Verification |
1307 |
| Online System Health Management |
1308 |
| About Online System Health Management |
1308 |
| Performing Internal Loopback Tests |
1309 |
| Performing External Loopback Tests |
1309 |
| Default Settings |
1309 |
| Launching Fabric Manager in Cisco SAN-OS Releases Prior to 3.2(1) |
1311 |
| Setting the Seed Switch in Cisco SAN-OS Releases 3.1(1) to 3.2(1) |
1311 |
| Setting the Seed Switch in Releases Prior to Cisco SAN-OS Release 3.1(1) |
1313 |
| Cisco Fabric Manager Unsupported Feature List |
1315 |
| Interface Nonoperational Reason Codes |
1319 |
| Managing Cisco FabricWare |
1321 |
| Fibre Channel Support |
1321 |
| Zone Configuration |
1322 |
| Security |
1322 |
| Events |
1322 |
| Managing Cisco FabricWare with Fabric Manager |
1323 |
| Configuration Limits for Cisco MDS SAN-OS Release 3.1(x) and 3.2(x) |
1325 |

 1
1 1,147
1,147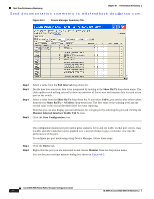 1,148
1,148 1,149
1,149 1,150
1,150 1,151
1,151 1,152
1,152 1,153
1,153 1,154
1,154 1,155
1,155 1,156
1,156 1,157
1,157

