HP HP12C hp 12c_user's guide_English_E_HDPMBF12E44.pdf - Page 35
Basic Financial Functions
 |
UPC - 882780792104
View all HP HP12C manuals
Add to My Manuals
Save this manual to your list of manuals |
Page 35 highlights
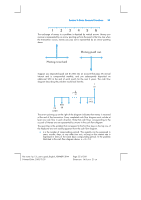
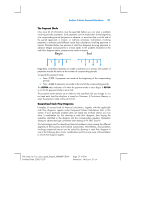
Section 3: Basic Financial Functions 35 The exchange of money in a problem is depicted by vertical arrows. Money you receive is represented by an arrow pointing up from the point in the time line when the transaction occurs; money you pay out is represented by an arrow pointing down. Suppose you deposited (paid out) $1,000 into an account that pays 6% annual interest and is compounded monthly, and you subsequently deposited an additional $50 at the end of each month for the next 2 years. The cash flow diagram describing the problem would look like this: The arrow pointing up at the right of the diagram indicates that money is received at the end of the transaction. Every completed cash flow diagram must include at least one cash flow in each direction. Note that cash flows corresponding to the accrual of interest are not represented by arrows in the cash flow diagram. The quantities in the problem that correspond to the first five keys on the top row of the keyboard are now readily apparent from the cash flow diagram. z n is the number of compounding periods. This quantity can be expressed in years, months, days, or any other time unit, as long as the interest rate is expressed in terms of the same basic compounding period. In the problem illustrated in the cash flow diagram above, n = 2 × 12. File name: hp 12c_user's guide_English_HDPMBF12E44 Printered Date: 2005/7/29 Page: 35 of 209 Dimension: 14.8 cm x 21 cm
-
 1
1 -
2
-
3
-
4
-
5
-
6
-
7
-
8
-
9
-
10
-
11
-
12
-
13
-
14
-
15
-
16
-
17
-
18
-
19
-
20
-
21
-
22
-
23
-
24
-
25
-
26
-
27
-
28
-
29
-
 30
30 -
 31
31 -
 32
32 -
 33
33 -
 34
34 -
 35
35 -
 36
36 -
 37
37 -
 38
38 -
 39
39 -
 40
40 -
41
-
42
-
43
-
44
-
45
-
46
-
47
-
48
-
49
-
50
-
51
-
52
-
53
-
54
-
55
-
56
-
57
-
58
-
59
-
60
-
61
-
62
-
63
-
64
-
65
-
66
-
67
-
68
-
69
-
70
-
71
-
72
-
73
-
74
-
75
-
76
-
77
-
78
-
79
-
80
-
81
-
82
-
83
-
84
-
85
-
86
-
87
-
88
-
89
-
90
-
91
-
92
-
93
-
94
-
95
-
96
-
97
-
98
-
99
-
100
-
101
-
102
-
103
-
104
-
105
-
106
-
107
-
108
-
109
-
110
-
111
-
112
-
113
-
114
-
115
-
116
-
117
-
118
-
119
-
120
-
121
-
122
-
123
-
124
-
125
-
126
-
127
-
128
-
129
-
130
-
131
-
132
-
133
-
134
-
135
-
136
-
137
-
138
-
139
-
140
-
141
-
142
-
143
-
144
-
145
-
146
-
147
-
148
-
149
-
150
-
151
-
152
-
153
-
154
-
155
-
156
-
157
-
158
-
159
-
160
-
161
-
162
-
163
-
164
-
165
-
166
-
167
-
168
-
169
-
170
-
171
-
172
-
173
-
174
-
175
-
176
-
177
-
178
-
179
-
180
-
181
-
182
-
183
-
184
-
185
-
186
-
187
-
188
-
189
-
190
-
191
-
192
-
193
-
194
-
195
-
196
-
197
-
198
-
199
-
200
-
201
-
202
-
203
-
204
-
205
-
206
-
207
-
208
-
209
-
210
-
211
 |
 |
