Canon CanoScan FB 630U User Guide - Page 34
Using the Histogram Feature to Adjust Image Contrast, How to Interpret Histograms
 |
View all Canon CanoScan FB 630U manuals
Add to My Manuals
Save this manual to your list of manuals |
Page 34 highlights
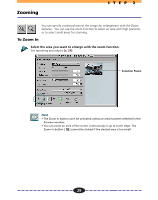
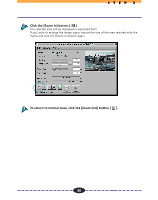
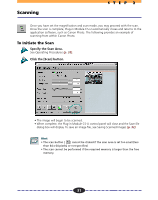
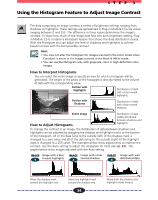
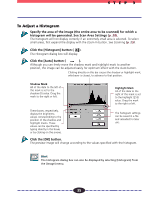
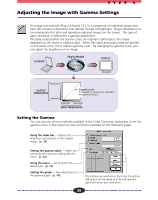
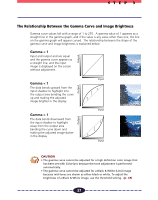
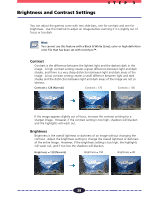
STEP 3 Using the Histogram Feature to Adjust Image Contrast The data comprising an image contains a variety of brightness settings ranging from shadows to highlights. These settings are represented in Plug-in Module CS-U by values ranging between 0 and 255. The difference in these values determines the image's contrast. To show how much of the image data falls into each brightness setting, Plugin Module CS-U contains a Histogram feature that shows this data distribution clearly. With the Histogram you can adjust the level of shadows and highlights to achieve beautiful tones with the best possible contrast. Hint • You may not alter the histogram for images scanned in the Color mode when ColorSync is active or for images scanned in the Black & White mode. • You can use the Histogram only with grayscale, color or high definition color images. How to Interpret Histograms You can select the entire image or specify an area for which a histogram will be generated. The height of the peaks of the histogram is directly related to the volume of data with the corresponding value. Portion with Highlights Distribution of data with a bias toward highlights. Portion with Shadows Distribution of data with a bias toward shadows. Entire Image How to Adjust Histograms Distribution of data widely distributed between shadows and highlights. To change the contrast in an image, the distribution of data between shadows and highlights can be adjusted by dragging the shadow and highlight marks at the bottom of the histogram. All of the data lying to the outside (left) of the shadow mark is changed to a zero value and all of the data lying to the outside (right) of the highlight mark is changed to a 255 value. The examples below show adjustments to improve the contrast. Use the Auto setting to adjust the Histogram for most jobs (p. 35). The graphs below show images adjusted with the Auto setting. IMAGE Image with a bias 1 toward highlights IMAGE Image with a bias 2 toward shadow IMAGE Image with well 3 distributed data Move the shadow mark toward the highlight end. Move the highlight mark toward the shadow end. 34 Move both the shadow and highlight marks inward.
-
 1
1 -
2
-
3
-
4
-
5
-
6
-
7
-
8
-
9
-
10
-
11
-
12
-
13
-
14
-
15
-
16
-
17
-
18
-
19
-
20
-
21
-
22
-
23
-
24
-
25
-
26
-
27
-
28
-
 29
29 -
 30
30 -
 31
31 -
 32
32 -
 33
33 -
 34
34 -
 35
35 -
 36
36 -
 37
37 -
 38
38 -
 39
39 -
40
-
41
-
42
-
43
-
44
-
45
-
46
-
47
-
48
-
49
-
50
-
51
-
52
-
53
-
54
-
55
-
56
-
57
-
58
-
59
-
60
-
61
-
62
 |
 |