Canon CanoScan FB 630U User Guide - Page 35
To Adjust a Histogram, Click the [Auto] button
 |
View all Canon CanoScan FB 630U manuals
Add to My Manuals
Save this manual to your list of manuals |
Page 35 highlights
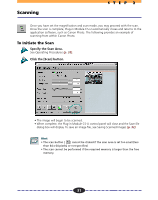
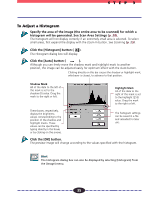
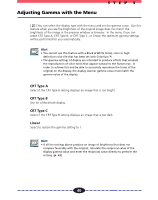
STEP 3 To Adjust a Histogram Specify the area of the image (the entire area to be scanned) for which a histogram will be generated. See Scan Area Settings (p. 28). The histogram will not display correctly if an extremely small area is selected. To select small areas, first expand the display with the Zoom In button. See Zooming (p. 29). Click the [Histogram] button ( ). The Histogram dialog box will display. Click the [Auto] button ( ). Although you can freely move the shadow mark and highlight mark to another position, the image can be adjusted easily for optimum effect with the Auto button. Clicking directly on this bar causes the shadow or highlight mark, whichever is closest, to advance to that position. Shadow Mark All of the data to the left of this mark is set to the shadow (0) value. Drag the mark to the right or left. Highlight Mark All of the data to the right of this mark is set to the highlight (255) value. Drag the mark to the right or left. These boxes, respectively, display the brightness values corresponding to the position of the shadow and highlight marks. These values can be specified by typing directly in the boxes or by clicking on the arrows. The histogram settings can be saved in a file and reloaded for later use. Click the [OK] button. The preview image will change according to the values specified with the histogram. Hint The Histogram dialog box can also be displayed by selecting [Histogram] from the [Image] menu. 35
-
 1
1 -
2
-
3
-
4
-
5
-
6
-
7
-
8
-
9
-
10
-
11
-
12
-
13
-
14
-
15
-
16
-
17
-
18
-
19
-
20
-
21
-
22
-
23
-
24
-
25
-
26
-
27
-
28
-
29
-
 30
30 -
 31
31 -
 32
32 -
 33
33 -
 34
34 -
 35
35 -
 36
36 -
 37
37 -
 38
38 -
 39
39 -
 40
40 -
41
-
42
-
43
-
44
-
45
-
46
-
47
-
48
-
49
-
50
-
51
-
52
-
53
-
54
-
55
-
56
-
57
-
58
-
59
-
60
-
61
-
62
 |
 |