Garmin Forerunner 245 Music Owners Manual - Page 20
Performance Measurements
 |
View all Garmin Forerunner 245 Music manuals
Add to My Manuals
Save this manual to your list of manuals |
Page 20 highlights
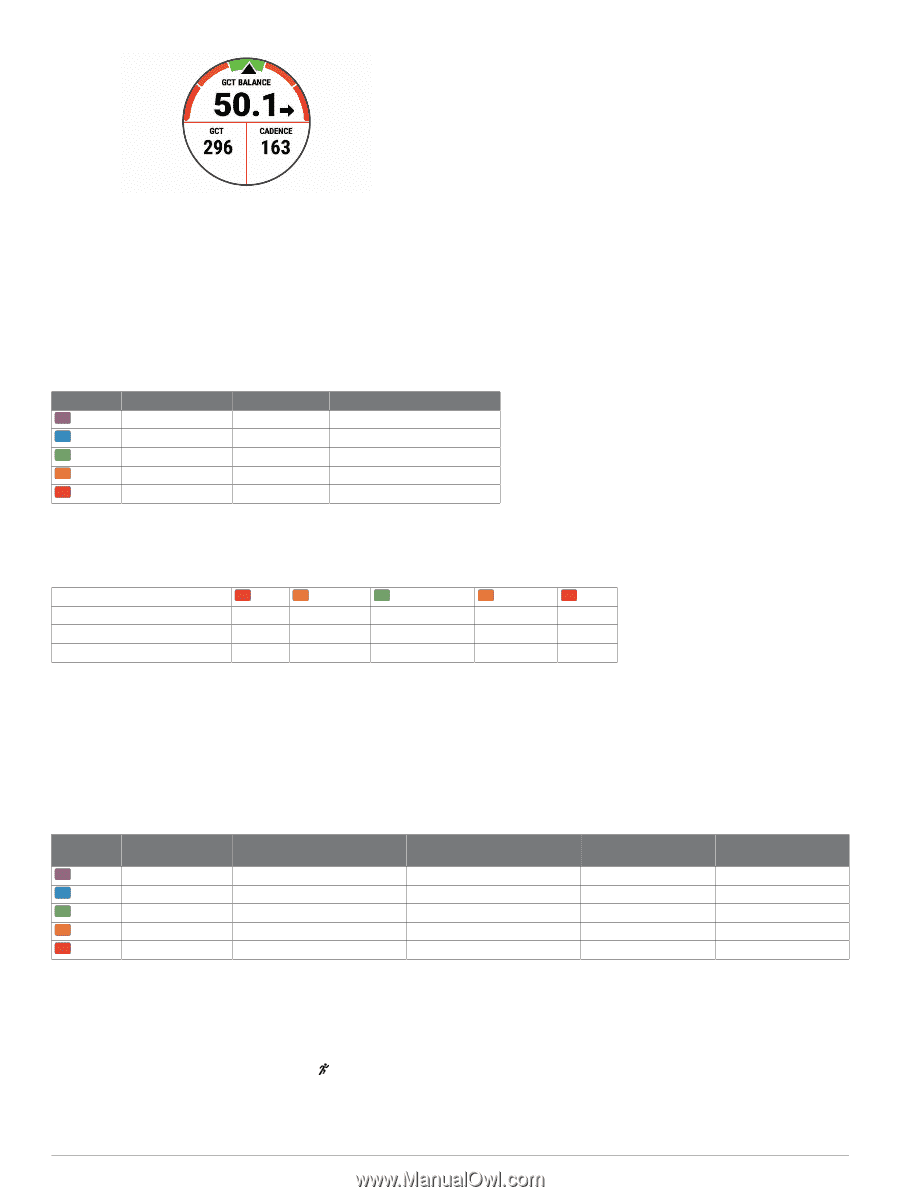
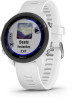
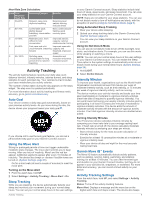
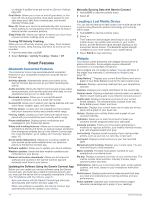
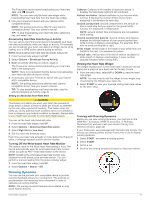
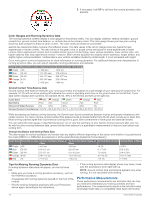
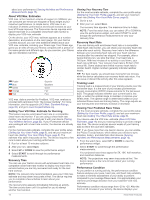
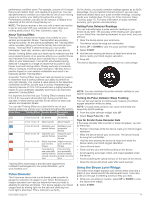
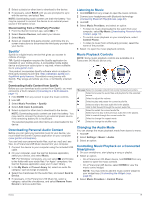
5 If necessary, hold UP to edit how the running dynamics data appears. Color Gauges and Running Dynamics Data The running dynamics screens display a color gauge for the primary metric. You can display cadence, vertical oscillation, ground contact time, ground contact time balance, or vertical ratio as the primary metric. The color gauge shows you how your running dynamics data compare to those of other runners. The color zones are based on percentiles. Garmin has researched many runners of all different levels. The data values in the red or orange zones are typical for less experienced or slower runners. The data values in the green, blue, or purple zones are typical for more experienced or faster runners. More experienced runners tend to exhibit shorter ground contact times, lower vertical oscillation, lower vertical ratio, and higher cadence than less experienced runners. However, taller runners typically have slightly slower cadences, longer strides, and slightly higher vertical oscillation. Vertical ratio is your vertical oscillation divided by stride length. It is not correlated with height. Go to www.garmin.com/runningdynamics for more information on running dynamics. For additional theories and interpretations of running dynamics data, you can search reputable running publications and websites. Color Zone Percentile in Zone Cadence Range Ground Contact Time Range Purple >95 >183 spm 52.2% R While developing and testing running dynamics, the Garmin team found correlations between injuries and greater imbalances with certain runners. For many runners, ground contact time balance tends to deviate further from 50-50 when running up or down hills. Most running coaches agree that a symmetrical running form is good. Elite runners tend to have quick and balanced strides. You can watch the color gauge or data field during your run or view the summary on your Garmin Connect account after your run. As with the other running dynamics data, ground contact time balance is a quantitative measurement to help you learn about your running form. Vertical Oscillation and Vertical Ratio Data The data ranges for vertical oscillation and vertical ratio are slightly different depending on the sensor and whether it is positioned at the chest (HRM-Tri or HRM-Run accessories) or at the waist (Running Dynamics Pod accessory). Color Zone Percentile in Zone Vertical Oscillation Range at Chest Purple >95
-
 1
1 -
2
-
3
-
4
-
5
-
6
-
7
-
8
-
9
-
10
-
11
-
12
-
13
-
14
-
 15
15 -
 16
16 -
 17
17 -
 18
18 -
 19
19 -
 20
20 -
 21
21 -
 22
22 -
 23
23 -
 24
24 -
 25
25 -
26
-
27
-
28
-
29
-
30
-
31
-
32
-
33
-
34
-
35
-
36
-
37
-
38
-
39
-
40
-
41
-
42
-
43
-
44
 |
 |