Netgear FSM726S FSM726S User Manual - Page 69
of 110
 |
UPC - 606449023091
View all Netgear FSM726S manuals
Add to My Manuals
Save this manual to your list of manuals |
Page 69 highlights
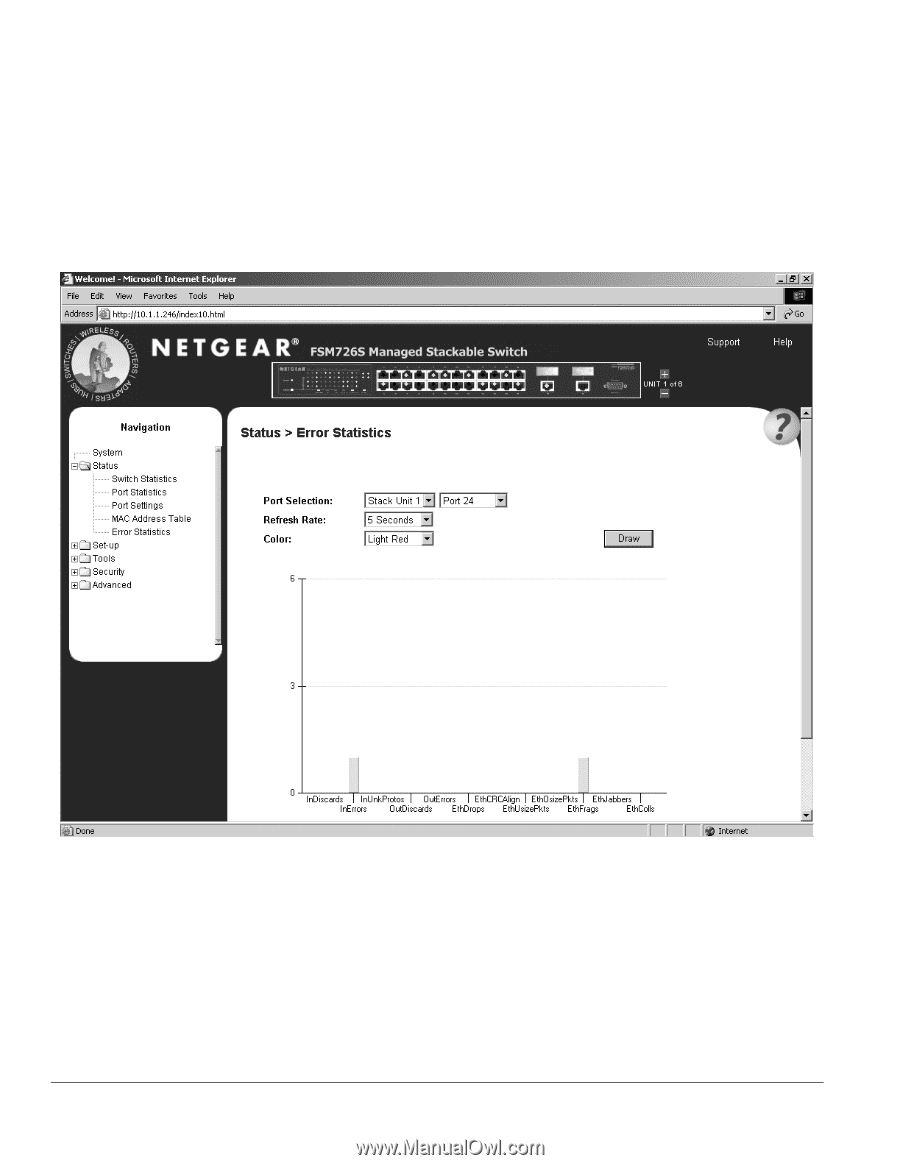
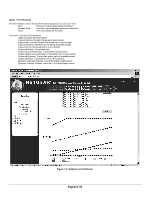
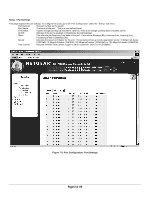
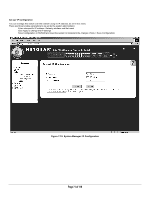
Status > Error Statistics The Error Statistics Graph allows you to chart one type of statistic for any combination of ports. In the case of the Error Statistics Graph, the chart will present data across time so that fluctuations in time can be easily seen. All charts have a maximum ceiling of more than 2.1 billion (2,147,483,647). You can see the value of each bar or line in the chart by clicking on the bar. The following will outline the settings for each type of graph. o Statistics The type of system errors to be monitored o Refresh Rate The time interval between automatic refreshes (5,10,15, 30 seconds) o Port Selection The port for data to be monitored When all of the variables are set, click Draw. Figure 7-8: Statistics: Error Statistics Page 69 of 110
-
 1
1 -
2
-
3
-
4
-
5
-
6
-
7
-
8
-
9
-
10
-
11
-
12
-
13
-
14
-
15
-
16
-
17
-
18
-
19
-
20
-
21
-
22
-
23
-
24
-
25
-
26
-
27
-
28
-
29
-
30
-
31
-
32
-
33
-
34
-
35
-
36
-
37
-
38
-
39
-
40
-
41
-
42
-
43
-
44
-
45
-
46
-
47
-
48
-
49
-
50
-
51
-
52
-
53
-
54
-
55
-
56
-
57
-
58
-
59
-
60
-
61
-
62
-
63
-
 64
64 -
 65
65 -
 66
66 -
 67
67 -
 68
68 -
 69
69 -
 70
70 -
 71
71 -
 72
72 -
 73
73 -
 74
74 -
75
-
76
-
77
-
78
-
79
-
80
-
81
-
82
-
83
-
84
-
85
-
86
-
87
-
88
-
89
-
90
-
91
-
92
-
93
-
94
-
95
-
96
-
97
-
98
-
99
-
100
-
101
-
102
-
103
-
104
-
105
-
106
-
107
-
108
-
109
-
110
 |
 |