Texas Instruments TI15TK Teacher Guide - Page 12
Analyzing Data and Drawing Conclusions, Repeat the activity
 |
UPC - 100000000137
View all Texas Instruments TI15TK manuals
Add to My Manuals
Save this manual to your list of manuals |
Page 12 highlights
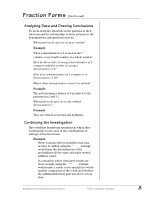
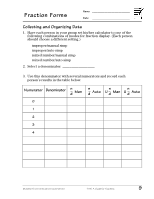
Name Patterns in Percent Date Analyzing Data and Drawing Conclusions 1. What patterns do you see in your tables? 2. What conjectures can you make from these patterns? 3. Repeat the activity with a different percent in the left column and compare your results. 4. Repeat the activity, changing the percents in the left column while keeping the total quantity constant. Now what patterns do you see? What conjectures can you make? © 2000 TEXAS INSTRUMENTS INCORPORATED TI-15: A Guide for Teachers 5
-
 1
1 -
2
-
3
-
4
-
5
-
6
-
 7
7 -
 8
8 -
 9
9 -
 10
10 -
 11
11 -
 12
12 -
 13
13 -
 14
14 -
 15
15 -
 16
16 -
 17
17 -
18
-
19
-
20
-
21
-
22
-
23
-
24
-
25
-
26
-
27
-
28
-
29
-
30
-
31
-
32
-
33
-
34
-
35
-
36
-
37
-
38
-
39
-
40
-
41
-
42
-
43
-
44
-
45
-
46
-
47
-
48
-
49
-
50
-
51
-
52
-
53
-
54
-
55
-
56
-
57
-
58
-
59
-
60
-
61
-
62
-
63
-
64
-
65
-
66
-
67
-
68
-
69
-
70
-
71
-
72
-
73
-
74
-
75
-
76
-
77
-
78
-
79
-
80
-
81
-
82
-
83
-
84
-
85
-
86
-
87
-
88
-
89
-
90
-
91
-
92
-
93
-
94
-
95
-
96
-
97
-
98
-
99
-
100
-
101
-
102
-
103
-
104
-
105
-
106
-
107
-
108
-
109
-
110
-
111
-
112
-
113
-
114
-
115
-
116
-
117
-
118
-
119
-
120
-
121
-
122
-
123
-
124
-
125
-
126
 |
 |

© 2000 T
EXAS
I
NSTRUMENTS
I
NCORPORATED
TI-15: A Guide for Teachers
5
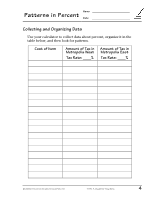
Patterns in Percent
Name
___________________________
Date
___________________________
Analyzing Data and Drawing Conclusions
1.
What patterns do you see in your tables?
__________________________________________________________________________
__________________________________________________________________________
__________________________________________________________________________
2.
What conjectures can you make from these patterns?
__________________________________________________________________________
__________________________________________________________________________
3.
Repeat the activity with a different percent in the left column and
compare your results.
__________________________________________________________________________
__________________________________________________________________________
4.
Repeat the activity, changing the percents in the left column while
keeping the total quantity constant. Now what patterns do you see?
What conjectures can you make?
__________________________________________________________________________
__________________________________________________________________________
__________________________________________________________________________
__________________________________________________________________________