Texas Instruments TI15TK Teacher Guide - Page 9
Patterns in Percent, Introduction, Collecting and Organizing Data
 |
UPC - 100000000137
View all Texas Instruments TI15TK manuals
Add to My Manuals
Save this manual to your list of manuals |
Page 9 highlights
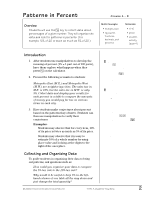
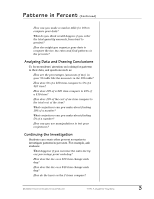
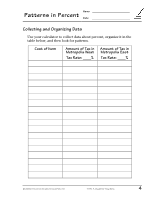
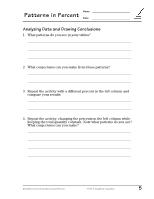
Patterns in Percent Overview Students will use the ª key to collect data about percentages of a given number. They will organize the data and look for patterns in percents. (For example, 10% of 20 is twice as much as 5% of 20.) Grades 4 - 6 Math Concepts • multiplication • equivalent fractions, decimals, and percents Materials • TI-15 • pencil • student activity (page 4) Introduction 1. After students use manipulatives to develop the meaning of percent (1% = 1 part out of 100 parts), have them explore what happens when they press ª on the calculator. 2. Present the following scenario to students: Metropolis East (M.E.) and Metropolis West (M.W.) are neighboring cities. The sales tax in M.E. is 10%, but the sales tax in M.W. is only 5%. Collect data and display your results for each percent in a table to compare the amounts of money you would pay for tax on various items in each city. 3. Have students make conjectures about percent based on the patterns they observe. Students can then use manipulatives to verify their conjectures. Examples: • Students may observe that for every item, 10% of its price is twice as much as 5% of its price. • Students may observe that it is easy to estimate 10% of a whole number by using place value and looking at the digits to the right of the ones place. ³ When a student enters a 6 ª, the TI-15 displays 6%. Then, when the student presses ®, the display changes to 6%= 0.06 to show that 6% is another way to write 0.06 or 6/100. ³ You will need to show students how to use multiplication on the TI-15 to express the percent of a given quantity. For example, to show 10% of $20: 1. Enter 10. 2. Press ª V. 3. Enter 20; press ®. Students can verify the calculator display of 2 by using manipulatives to show 10% of $20 = $2. Collecting and Organizing Data To guide students in organizing their data to bring out patterns, ask questions such as: • How could you organize your data to compare the 5% tax rate to the 10% tax rate? • Why would it be useful to keep 5% in the lefthand column of one table all the way down and just change the total quantity? © 2000 TEXAS INSTRUMENTS INCORPORATED TI-15: A Guide for Teachers 2
-
 1
1 -
2
-
3
-
 4
4 -
 5
5 -
 6
6 -
 7
7 -
 8
8 -
 9
9 -
 10
10 -
 11
11 -
 12
12 -
 13
13 -
 14
14 -
15
-
16
-
17
-
18
-
19
-
20
-
21
-
22
-
23
-
24
-
25
-
26
-
27
-
28
-
29
-
30
-
31
-
32
-
33
-
34
-
35
-
36
-
37
-
38
-
39
-
40
-
41
-
42
-
43
-
44
-
45
-
46
-
47
-
48
-
49
-
50
-
51
-
52
-
53
-
54
-
55
-
56
-
57
-
58
-
59
-
60
-
61
-
62
-
63
-
64
-
65
-
66
-
67
-
68
-
69
-
70
-
71
-
72
-
73
-
74
-
75
-
76
-
77
-
78
-
79
-
80
-
81
-
82
-
83
-
84
-
85
-
86
-
87
-
88
-
89
-
90
-
91
-
92
-
93
-
94
-
95
-
96
-
97
-
98
-
99
-
100
-
101
-
102
-
103
-
104
-
105
-
106
-
107
-
108
-
109
-
110
-
111
-
112
-
113
-
114
-
115
-
116
-
117
-
118
-
119
-
120
-
121
-
122
-
123
-
124
-
125
-
126
 |
 |