ZyXEL NBG6503 User Guide - Page 60
Table 26, Label, Description
 |
View all ZyXEL NBG6503 manuals
Add to My Manuals
Save this manual to your list of manuals |
Page 60 highlights
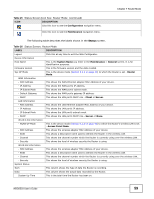
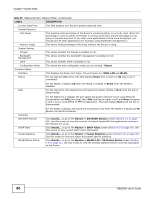
Chapter 7 Router Mode Table 26 Status Screen: Router Mode (continued) LABEL DESCRIPTION Current Date/Time This field displays your Router's present date and time. System Resource - CPU Usage This displays what percentage of the Router's processing ability is currently used. When this percentage is close to 100%, the Router is running at full load, and the throughput is not going to improve anymore. If you want some applications to have more throughput, you should turn off other applications (for example, using bandwidth management.) - Memory Usage This shows what percentage of the heap memory the Router is using. System Setting - Firewall This shows whether the firewall is enabled or not. - Bandwidth Management This shows whether the bandwidth management is enabled or not. - UPnP This shows whether UPnP is enabled or not. - Configuration Mode This shows the web configurator mode you are viewing - Expert. Interface Status Interface This displays the Router port types. The port types are: WAN, LAN and WLAN. Status For the LAN and WAN ports, this field displays Down (line is down) or Up (line is up or connected). Rate For the WLAN, it displays Up when the WLAN is enabled or Down when the WLAN is disabled. For the LAN ports, this displays the port speed and duplex setting or N/A when the line is disconnected. For the WAN port, it displays the port speed and duplex setting if you're using Ethernet encapsulation and Idle (line (ppp) idle), Dial (starting to trigger a call) and Drop (dropping a call) if you're using PPPoE or PPTP encapsulation. This field displays N/A when the line is disconnected. Summary BW MGMT Monitor DHCP Table Packet Statistics WLAN Station Status For the WLAN, it displays the maximum transmission rate when the WLAN is enabled and N/ A when the WLAN is disabled. Click Details... to go to the Monitor > BW MGMT Monitor screen (Section 4.4 on page 39). Use this screen to view the amount of network bandwidth that applications running in the network are using. Click Details... to go to the Monitor > DHCP Table screen (Section 4.5 on page 39). Use this screen to view current DHCP client information. Click Details... to go to the Monitor > Packet Statistics screen (Section 4.6 on page 40). Use this screen to view port status and packet specific statistics. Click Details... to go to the Monitor > WLAN 2.4G / 5G Station Status screen (Section 4.8 on page 41). Use this screen to view the wireless stations that are currently associated to the Router. 60 NBG6503 User's Guide
-
 1
1 -
2
-
3
-
4
-
5
-
6
-
7
-
8
-
9
-
10
-
11
-
12
-
13
-
14
-
15
-
16
-
17
-
18
-
19
-
20
-
21
-
22
-
23
-
24
-
25
-
26
-
27
-
28
-
29
-
30
-
31
-
32
-
33
-
34
-
35
-
36
-
37
-
38
-
39
-
40
-
41
-
42
-
43
-
44
-
45
-
46
-
47
-
48
-
49
-
50
-
51
-
52
-
53
-
54
-
 55
55 -
 56
56 -
 57
57 -
 58
58 -
 59
59 -
 60
60 -
 61
61 -
 62
62 -
 63
63 -
 64
64 -
 65
65 -
66
-
67
-
68
-
69
-
70
-
71
-
72
-
73
-
74
-
75
-
76
-
77
-
78
-
79
-
80
-
81
-
82
-
83
-
84
-
85
-
86
-
87
-
88
-
89
-
90
-
91
-
92
-
93
-
94
-
95
-
96
-
97
-
98
-
99
-
100
-
101
-
102
-
103
-
104
-
105
-
106
-
107
-
108
-
109
-
110
-
111
-
112
-
113
-
114
-
115
-
116
-
117
-
118
-
119
-
120
-
121
-
122
-
123
-
124
-
125
-
126
-
127
-
128
-
129
-
130
-
131
-
132
-
133
-
134
-
135
-
136
-
137
-
138
-
139
-
140
-
141
-
142
-
143
-
144
-
145
-
146
-
147
-
148
-
149
-
150
-
151
-
152
-
153
-
154
-
155
-
156
-
157
-
158
-
159
-
160
-
161
-
162
-
163
-
164
-
165
-
166
-
167
-
168
-
169
-
170
-
171
-
172
-
173
-
174
-
175
-
176
-
177
-
178
-
179
-
180
-
181
-
182
-
183
-
184
-
185
-
186
-
187
-
188
-
189
-
190
-
191
-
192
-
193
-
194
-
195
-
196
-
197
-
198
-
199
-
200
-
201
-
202
-
203
-
204
-
205
-
206
-
207
-
208
-
209
-
210
-
211
-
212
-
213
-
214
-
215
-
216
-
217
-
218
-
219
-
220
-
221
-
222
-
223
-
224
-
225
-
226
-
227
-
228
-
229
-
230
-
231
-
232
-
233
-
234
-
235
-
236
-
237
-
238
-
239
-
240
 |
 |
