ZyXEL Vantage Report 2.3 User Guide - Page 283
Top Attack Sources
 |
View all ZyXEL Vantage Report 2.3 manuals
Add to My Manuals
Save this manual to your list of manuals |
Page 283 highlights
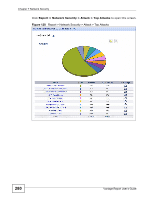
Chapter 7 Network Security Each field is described in the following table. Table 116 Report > Network Security > Attack > Top Attacks > Drill-Down LABEL DESCRIPTION graph The graph displays the information in the table visually. Source Color Attacks % of Attacks View Logs Total Back • Click the Pie View or the Bar View icon. You can specify the Default Chart Type in System > General Configuration. • Move your mouse over a slice in the pie chart or a bar in the bar chart to display its identification. • Click on a slice in the pie chart to move it away from the pie chart a little. This field displays the top senders of the selected category of DoS attacks. This field displays what color represents each source in the graph. This field displays the number of DoS attacks in the selected category that came from each source. This field displays what percentage of all DoS attacks in the selected category came from each source. Click this icon to see the logs that go with the record. This entry displays the totals for the sources above. If the number of sources of the selected category of DoS attacks is greater than the maximum number of records displayed in this table, this total might be a little lower than the total in the main report. Click this to return to the main report. 7.2.5 Top Attack Sources Use this report to look at the top sources of DoS attacks by number of attacks. Note: To look at attack reports, each ZyXEL device must record DoS attacks in its log. See the User's Guide for each ZyXEL device for more information. In most devices, go to Logs > Log Settings, and make sure Attacks is enabled. Vantage Report User's Guide 283
-
 1
1 -
2
-
3
-
4
-
5
-
6
-
7
-
8
-
9
-
10
-
11
-
12
-
13
-
14
-
15
-
16
-
17
-
18
-
19
-
20
-
21
-
22
-
23
-
24
-
25
-
26
-
27
-
28
-
29
-
30
-
31
-
32
-
33
-
34
-
35
-
36
-
37
-
38
-
39
-
40
-
41
-
42
-
43
-
44
-
45
-
46
-
47
-
48
-
49
-
50
-
51
-
52
-
53
-
54
-
55
-
56
-
57
-
58
-
59
-
60
-
61
-
62
-
63
-
64
-
65
-
66
-
67
-
68
-
69
-
70
-
71
-
72
-
73
-
74
-
75
-
76
-
77
-
78
-
79
-
80
-
81
-
82
-
83
-
84
-
85
-
86
-
87
-
88
-
89
-
90
-
91
-
92
-
93
-
94
-
95
-
96
-
97
-
98
-
99
-
100
-
101
-
102
-
103
-
104
-
105
-
106
-
107
-
108
-
109
-
110
-
111
-
112
-
113
-
114
-
115
-
116
-
117
-
118
-
119
-
120
-
121
-
122
-
123
-
124
-
125
-
126
-
127
-
128
-
129
-
130
-
131
-
132
-
133
-
134
-
135
-
136
-
137
-
138
-
139
-
140
-
141
-
142
-
143
-
144
-
145
-
146
-
147
-
148
-
149
-
150
-
151
-
152
-
153
-
154
-
155
-
156
-
157
-
158
-
159
-
160
-
161
-
162
-
163
-
164
-
165
-
166
-
167
-
168
-
169
-
170
-
171
-
172
-
173
-
174
-
175
-
176
-
177
-
178
-
179
-
180
-
181
-
182
-
183
-
184
-
185
-
186
-
187
-
188
-
189
-
190
-
191
-
192
-
193
-
194
-
195
-
196
-
197
-
198
-
199
-
200
-
201
-
202
-
203
-
204
-
205
-
206
-
207
-
208
-
209
-
210
-
211
-
212
-
213
-
214
-
215
-
216
-
217
-
218
-
219
-
220
-
221
-
222
-
223
-
224
-
225
-
226
-
227
-
228
-
229
-
230
-
231
-
232
-
233
-
234
-
235
-
236
-
237
-
238
-
239
-
240
-
241
-
242
-
243
-
244
-
245
-
246
-
247
-
248
-
249
-
250
-
251
-
252
-
253
-
254
-
255
-
256
-
257
-
258
-
259
-
260
-
261
-
262
-
263
-
264
-
265
-
266
-
267
-
268
-
269
-
270
-
271
-
272
-
273
-
274
-
275
-
276
-
277
-
 278
278 -
 279
279 -
 280
280 -
 281
281 -
 282
282 -
 283
283 -
 284
284 -
 285
285 -
 286
286 -
 287
287 -
 288
288 -
289
-
290
-
291
-
292
-
293
-
294
-
295
-
296
-
297
-
298
-
299
-
300
-
301
-
302
-
303
-
304
-
305
-
306
-
307
-
308
-
309
-
310
-
311
-
312
-
313
-
314
-
315
-
316
-
317
-
318
-
319
-
320
-
321
-
322
-
323
-
324
-
325
-
326
-
327
-
328
-
329
-
330
-
331
-
332
-
333
-
334
-
335
-
336
-
337
-
338
-
339
-
340
-
341
-
342
-
343
-
344
-
345
-
346
-
347
-
348
-
349
-
350
-
351
-
352
-
353
-
354
-
355
-
356
-
357
-
358
-
359
-
360
-
361
-
362
-
363
-
364
-
365
-
366
-
367
-
368
-
369
-
370
-
371
-
372
-
373
-
374
-
375
-
376
-
377
-
378
-
379
-
380
-
381
-
382
-
383
-
384
-
385
-
386
-
387
-
388
-
389
-
390
-
391
-
392
-
393
-
394
-
395
-
396
-
397
-
398
-
399
-
400
-
401
-
402
-
403
-
404
-
405
-
406
-
407
-
408
-
409
-
410
-
411
-
412
-
413
-
414
-
415
-
416
-
417
-
418
-
419
-
420
-
421
-
422
-
423
-
424
-
425
-
426
-
427
-
428
-
429
-
430
-
431
-
432
-
433
-
434
-
435
-
436
-
437
-
438
-
439
-
440
-
441
-
442
-
443
-
444
-
445
-
446
-
447
-
448
-
449
-
450
-
451
-
452
-
453
-
454
-
455
-
456
-
457
-
458
-
459
-
460
-
461
-
462
-
463
-
464
-
465
-
466
-
467
-
468
-
469
-
470
-
471
-
472
-
473
-
474
-
475
-
476
-
477
-
478
-
479
-
480
-
481
-
482
-
483
-
484
-
485
-
486
-
487
-
488
-
489
-
490
-
491
-
492
-
493
-
494
-
495
-
496
-
497
-
498
-
499
-
500
-
501
-
502
-
503
-
504
-
505
-
506
-
507
-
508
-
509
-
510
-
511
-
512
-
513
-
514
-
515
-
516
-
517
-
518
-
519
-
520
-
521
-
522
-
523
-
524
-
525
-
526
-
527
-
528
-
529
-
530
-
531
-
532
-
533
-
534
-
535
-
536
-
537
-
538
-
539
-
540
-
541
-
542
-
543
-
544
-
545
-
546
-
547
-
548
-
549
-
550
-
551
-
552
-
553
-
554
-
555
-
556
-
557
-
558
-
559
-
560
-
561
-
562
-
563
-
564
-
565
-
566
-
567
-
568
-
569
-
570
-
571
-
572
-
573
-
574
-
575
-
576
-
577
-
578
-
579
-
580
-
581
-
582
-
583
-
584
-
585
-
586
-
587
-
588
-
589
-
590
-
591
-
592
-
593
-
594
-
595
-
596
-
597
-
598
-
599
-
600
-
601
-
602
-
603
-
604
-
605
-
606
-
607
-
608
-
609
-
610
-
611
-
612
-
613
-
614
-
615
-
616
-
617
-
618
-
619
-
620
-
621
-
622
-
623
-
624
-
625
-
626
-
627
-
628
-
629
-
630
-
631
-
632
-
633
-
634
-
635
-
636
-
637
-
638
-
639
-
640
-
641
-
642
-
643
-
644
-
645
-
646
-
647
-
648
-
649
-
650
-
651
-
652
-
653
-
654
-
655
-
656
-
657
-
658
-
659
-
660
-
661
-
662
-
663
-
664
-
665
-
666
-
667
-
668
-
669
-
670
-
671
-
672
-
673
-
674
-
675
-
676
-
677
-
678
-
679
-
680
-
681
-
682
-
683
-
684
-
685
-
686
-
687
-
688
-
689
-
690
-
691
-
692
-
693
-
694
-
695
-
696
-
697
-
698
-
699
-
700
-
701
-
702
-
703
-
704
-
705
-
706
-
707
-
708
-
709
-
710
-
711
-
712
-
713
-
714
-
715
-
716
 |
 |
