Casio FX-9750GII-SC User Guide - Page 380
Graph Analysis Tool Graph Screen Operations, Graph Screen Key Operations
 |
UPC - 079767186067
View all Casio FX-9750GII-SC manuals
Add to My Manuals
Save this manual to your list of manuals |
Page 380 highlights
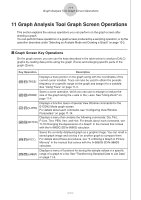
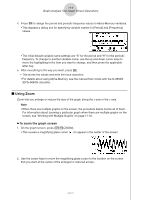
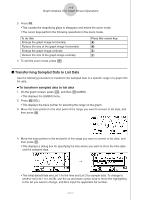
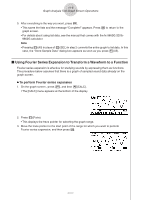
11-1 Graph Analysis Tool Graph Screen Operations 11 Graph Analysis Tool Graph Screen Operations This section explains the various operations you can perform on the graph screen after drawing a graph. You can perform these operations on a graph screen produced by a sampling operation, or by the operation described under "Selecting an Analysis Mode and Drawing a Graph" on page 10-2. k Graph Screen Key Operations On the graph screen, you can use the keys described in the table below to analyze (CALC) graphs by reading data points along the graph (Trace) and enlarging specific parts of the graph (Zoom). Key Operation Description !1(TRCE) Displays a trace pointer on the graph along with the coordinates of the current cursor location. Trace can also be used to obtain the periodic frequency of a specific range on the graph and assign it to a variable. See "Using Trace" on page 11-3. Starts a zoom operation, which you can use to enlarge or reduce the !2(ZOOM) size of the graph along the x-axis or the y-axis. See "Using Zoom" on page 11-4. !3(V-WIN) Displays a function menu of special View Window commands for the E-CON2 Mode graph screen. For details about each command, see "Configuring View Window Parameters" on page 11-14. Displays a menu that contains the following commands: Cls, Plot, !4(SKTCH) F-Line, Text, PEN, Vert, and Hztl. For details about each command, see "5-10 Changing the Appearance of a Graph" in the manual that comes with the fx-9860G SD/fx-9860G calculator. K1(PICT) Saves the currently displayed graph as a graphic image. You can recall a saved graph image and overlay it on another graph to compare them. For details about these procedures, see "5-4 Storing a Graph in Picture Memory" in the manual that comes with the fx-9860G SD/fx-9860G calculator. Displays a menu of functions for saving the sample values in a specific K2(LMEM) range of a graph to a list. See "Transforming Sampled Data to List Data" on page 11-5. 2005710101
-
 1
1 -
2
-
3
-
4
-
5
-
6
-
7
-
8
-
9
-
10
-
11
-
12
-
13
-
14
-
15
-
16
-
17
-
18
-
19
-
20
-
21
-
22
-
23
-
24
-
25
-
26
-
27
-
28
-
29
-
30
-
31
-
32
-
33
-
34
-
35
-
36
-
37
-
38
-
39
-
40
-
41
-
42
-
43
-
44
-
45
-
46
-
47
-
48
-
49
-
50
-
51
-
52
-
53
-
54
-
55
-
56
-
57
-
58
-
59
-
60
-
61
-
62
-
63
-
64
-
65
-
66
-
67
-
68
-
69
-
70
-
71
-
72
-
73
-
74
-
75
-
76
-
77
-
78
-
79
-
80
-
81
-
82
-
83
-
84
-
85
-
86
-
87
-
88
-
89
-
90
-
91
-
92
-
93
-
94
-
95
-
96
-
97
-
98
-
99
-
100
-
101
-
102
-
103
-
104
-
105
-
106
-
107
-
108
-
109
-
110
-
111
-
112
-
113
-
114
-
115
-
116
-
117
-
118
-
119
-
120
-
121
-
122
-
123
-
124
-
125
-
126
-
127
-
128
-
129
-
130
-
131
-
132
-
133
-
134
-
135
-
136
-
137
-
138
-
139
-
140
-
141
-
142
-
143
-
144
-
145
-
146
-
147
-
148
-
149
-
150
-
151
-
152
-
153
-
154
-
155
-
156
-
157
-
158
-
159
-
160
-
161
-
162
-
163
-
164
-
165
-
166
-
167
-
168
-
169
-
170
-
171
-
172
-
173
-
174
-
175
-
176
-
177
-
178
-
179
-
180
-
181
-
182
-
183
-
184
-
185
-
186
-
187
-
188
-
189
-
190
-
191
-
192
-
193
-
194
-
195
-
196
-
197
-
198
-
199
-
200
-
201
-
202
-
203
-
204
-
205
-
206
-
207
-
208
-
209
-
210
-
211
-
212
-
213
-
214
-
215
-
216
-
217
-
218
-
219
-
220
-
221
-
222
-
223
-
224
-
225
-
226
-
227
-
228
-
229
-
230
-
231
-
232
-
233
-
234
-
235
-
236
-
237
-
238
-
239
-
240
-
241
-
242
-
243
-
244
-
245
-
246
-
247
-
248
-
249
-
250
-
251
-
252
-
253
-
254
-
255
-
256
-
257
-
258
-
259
-
260
-
261
-
262
-
263
-
264
-
265
-
266
-
267
-
268
-
269
-
270
-
271
-
272
-
273
-
274
-
275
-
276
-
277
-
278
-
279
-
280
-
281
-
282
-
283
-
284
-
285
-
286
-
287
-
288
-
289
-
290
-
291
-
292
-
293
-
294
-
295
-
296
-
297
-
298
-
299
-
300
-
301
-
302
-
303
-
304
-
305
-
306
-
307
-
308
-
309
-
310
-
311
-
312
-
313
-
314
-
315
-
316
-
317
-
318
-
319
-
320
-
321
-
322
-
323
-
324
-
325
-
326
-
327
-
328
-
329
-
330
-
331
-
332
-
333
-
334
-
335
-
336
-
337
-
338
-
339
-
340
-
341
-
342
-
343
-
344
-
345
-
346
-
347
-
348
-
349
-
350
-
351
-
352
-
353
-
354
-
355
-
356
-
357
-
358
-
359
-
360
-
361
-
362
-
363
-
364
-
365
-
366
-
367
-
368
-
369
-
370
-
371
-
372
-
373
-
374
-
 375
375 -
 376
376 -
 377
377 -
 378
378 -
 379
379 -
 380
380 -
 381
381 -
 382
382 -
 383
383 -
 384
384 -
 385
385 -
386
-
387
-
388
-
389
-
390
-
391
-
392
-
393
-
394
-
395
-
396
-
397
-
398
-
399
-
400
-
401
-
402
 |
 |