D-Link DES 6000 Product Manual - Page 77
Port Packet Error Statistics,
 |
UPC - 790069239328
View all D-Link DES 6000 manuals
Add to My Manuals
Save this manual to your list of manuals |
Page 77 highlights
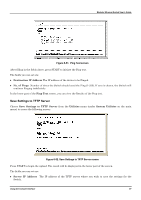
Modular Ethernet Switch User's Guide The statistic counters displayed are defined as follows: ♦ Speed If the link is up, the speed and duplex status will be displayed; if the link is down "-" will be displayed. ♦ % Utilization This shows the percentage of available bandwidth each port is using during a single second at the time specified by the update interval. The utilization percentage is the total number of bits transmitted and received on the port per second divided by the bandwidth per second. Please note that bandwidth values are doubled for full-duplex connections (i.e. 100BASE-TX at full duplex is 200Mbps). ♦ Bytes Recv. The number of good bytes received. This also includes local and dropped packets. ♦ Bytes Sent The number of good bytes sent from the respective port. ♦ Frames Recv. The number of good frames received. This also includes local and dropped packets. ♦ Frames Sent The number of good frames sent from the respective port. ♦ Total Bytes Recv. The number of bytes received, good and bad. ♦ Total Frames Recv. The number of frames received, good and bad. ♦ Last Seen MAC The MAC address of the last device that sent packets over this port. Port Packet Error Statistics To access the third item on the Traffic Statistics menu, choose Port Packet Error Statistics. The following table appears: Figure 6-59. Port Packet Error Statistics table Select the desired device in the Switch field, the desired setting in the Ports field, and the desired increment setting in the Update Interval field: 5 sec, 15 sec, 30 sec, 1 min, or Suspend. The statistic counters displayed are defined as follows: ♦ Speed If the link is up, the speed and duplex status will be displayed; if the link is down "-" will be displayed. ♦ CRC Error The number of frames that fail the CRC integrity check. ♦ Oversize The number of good frames with length greater than 1536 bytes and therefore are greater than the maximum legal length. 72 Using the Console Interface
-
 1
1 -
2
-
3
-
4
-
5
-
6
-
7
-
8
-
9
-
10
-
11
-
12
-
13
-
14
-
15
-
16
-
17
-
18
-
19
-
20
-
21
-
22
-
23
-
24
-
25
-
26
-
27
-
28
-
29
-
30
-
31
-
32
-
33
-
34
-
35
-
36
-
37
-
38
-
39
-
40
-
41
-
42
-
43
-
44
-
45
-
46
-
47
-
48
-
49
-
50
-
51
-
52
-
53
-
54
-
55
-
56
-
57
-
58
-
59
-
60
-
61
-
62
-
63
-
64
-
65
-
66
-
67
-
68
-
69
-
70
-
71
-
 72
72 -
 73
73 -
 74
74 -
 75
75 -
 76
76 -
 77
77 -
 78
78 -
 79
79 -
 80
80 -
 81
81 -
 82
82 -
83
-
84
-
85
-
86
-
87
-
88
-
89
-
90
-
91
-
92
-
93
-
94
-
95
-
96
-
97
-
98
-
99
-
100
-
101
-
102
-
103
-
104
-
105
-
106
-
107
-
108
-
109
-
110
-
111
-
112
-
113
-
114
-
115
-
116
-
117
-
118
-
119
-
120
-
121
-
122
-
123
-
124
-
125
-
126
-
127
-
128
-
129
-
130
-
131
-
132
-
133
-
134
-
135
-
136
-
137
-
138
-
139
 |
 |
