Sony PCWA-C500 Operating Instructions - Page 54
Signal Log tab, Wide Plot button / Narrow Plot button
 |
View all Sony PCWA-C500 manuals
Add to My Manuals
Save this manual to your list of manuals |
Page 54 highlights
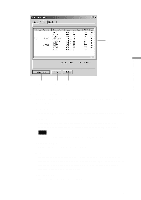
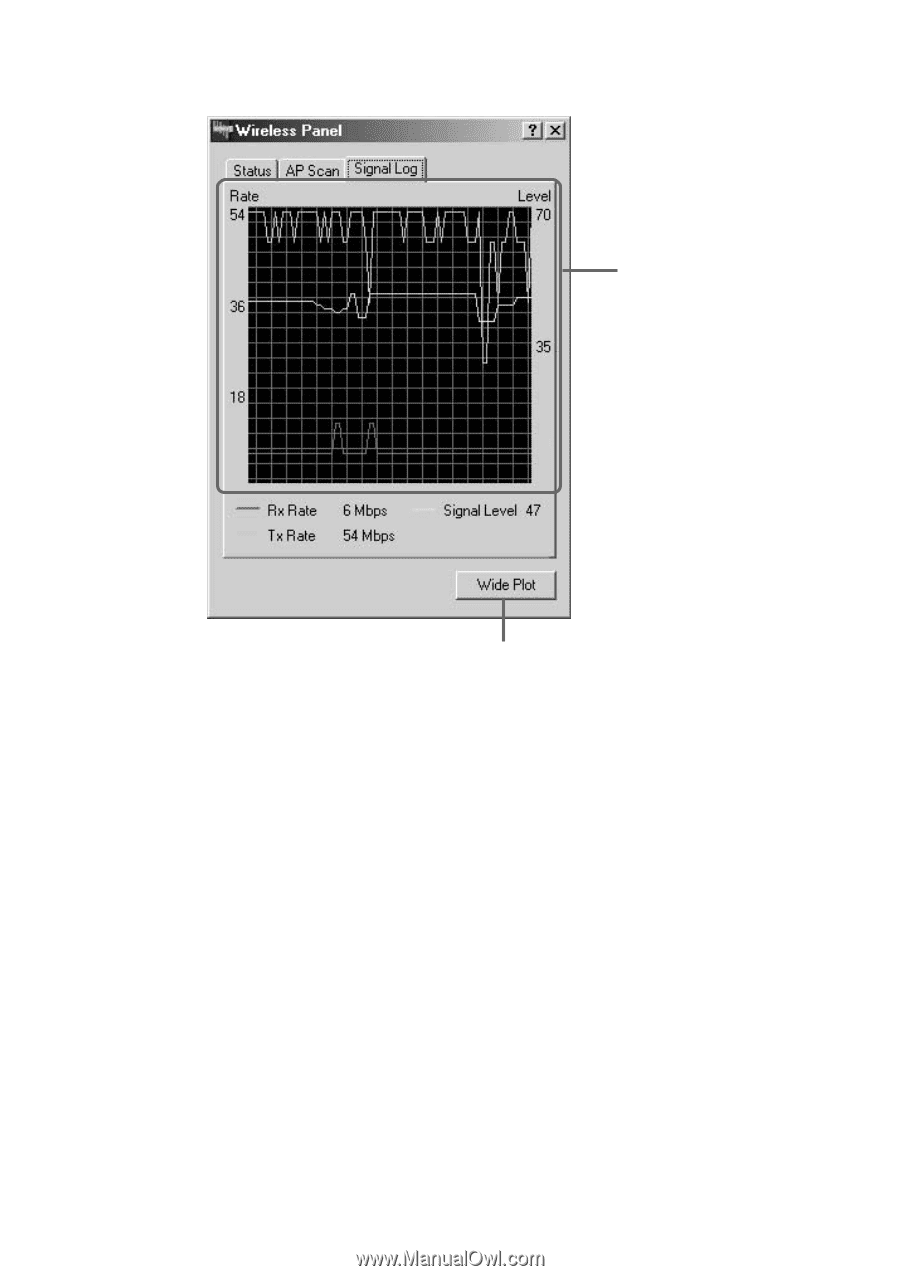
Signal Log tab 1 2 1 Signal Log Displays the signal status and signal rate for signals as a graph. The red line indicates the data reception rate, the green line the transmission rate, and the blue line the signal level (strength). 2 Wide Plot button / Narrow Plot button This button toggles between the Wide Plot and the Narrow Plot display modes. When in Narrow Plot mode, click the Wide Plot button to increase the width of the window. When in Wide Plot mode, click the Narrow Plot button to return the window to its original (narrow) size. 54
-
 1
1 -
2
-
3
-
4
-
5
-
6
-
7
-
8
-
9
-
10
-
11
-
12
-
13
-
14
-
15
-
16
-
17
-
18
-
19
-
20
-
21
-
22
-
23
-
24
-
25
-
26
-
27
-
28
-
29
-
30
-
31
-
32
-
33
-
34
-
35
-
36
-
37
-
38
-
39
-
40
-
41
-
42
-
43
-
44
-
45
-
46
-
47
-
48
-
 49
49 -
 50
50 -
 51
51 -
 52
52 -
 53
53 -
 54
54 -
 55
55 -
 56
56 -
 57
57 -
 58
58 -
 59
59 -
60
-
61
-
62
-
63
-
64
 |
 |
54
Signal Log tab
1
Signal Log
Displays the signal status and signal rate for signals as a graph.
The red line indicates the data reception rate, the green line the
transmission rate, and the blue line the signal level (strength).
2
Wide Plot button / Narrow Plot button
This button toggles between the Wide Plot and the Narrow Plot display
modes.
When in Narrow Plot mode, click the Wide Plot button to increase the
width of the window. When in Wide Plot mode, click the Narrow Plot
button to return the window to its original (narrow) size.
1
2