Cisco SRW2024P User Guide - Page 38
Alarm Entry
 |
UPC - 745883571000
View all Cisco SRW2024P manuals
Add to My Manuals
Save this manual to your list of manuals |
Page 38 highlights
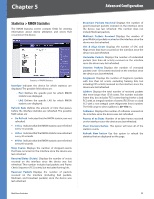
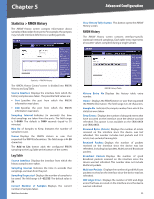
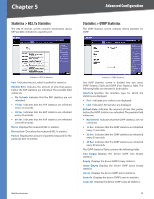
Chapter 5 Advanced Configuration Undersize Packets Displays the number of undersized packets (less than 64 octets) received on the interface since the device was last refreshed. Oversize Packets Displays the number of oversized packets (over 1518 octets) received on the interface since the device was last refreshed. Fragments Displays the number of fragments (packets with less than 64 octets, excluding framing bits, but including FCS octets) received on the interface since the device was last refreshed. Jabbers Displays the total number of received packets that were longer than 1518 octets. This number excludes frame bits, but includes FCS octets that had either a bad Frame Check Sequence (FCS) with an integral number of octets (FCS Error) or a bad FCS with a non-integral octet (Alignment Error) number. The field range to detect jabbers is 20-150 ms. Collisions Displays the number of collisions received on the interface since the device was last refreshed. Utilization Displays the percentage of the interface utilized. Statistics > RMON Alarm The RMON Alarm screen contains fields for setting network alarms. Network alarms occur when a network problem, or event, is detected. Rising and falling thresholds generate events. Statistics > RMON Alarm Alarm Entry Indicates a specific alarm. Source Interface Displays the interface for which RMON statistics are displayed. The possible field values are: •• Port Displays the RMON statistics for the selected port. •• LAG Displays the RMON statistics for the selected LAG. Counter Name Displays the selected MIB variable. WebView Switches Sample Type Defines the sampling method for the selected variable and comparing the value against the thresholds. The possible field values are: •• Absolute Compares the values directly with the thresholds at the end of the sampling interval. •• Delta Subtracts the last sampled value from the current value. The difference in the values is compared to the threshold. Rising Threshold Displays the rising counter value that triggers the rising threshold alarm. The rising threshold is presented on top of the graph bars. Each monitored variable is designated a color. Rising Event Displays the mechanism in which the alarms are reported. The possible field values are: •• LOG Indicates there is not a saving mechanism for either the device or in the management system. If the device is not reset, the entry remains in the Log Table. •• TRAP Indicates that an SNMP trap is generated, and sent via the Trap mechanism. The Trap can also be saved using the Trap mechanism. •• Both Indicates that both the Log and Trap mechanism are used to report alarms. Falling Threshold Displays the falling counter value that triggers the falling threshold alarm. The falling threshold is graphically presented on top of the graph bars. Each monitored variable is designated a color. Falling Event Displays the mechanism in which the alarms are reported. The possible field values are: •• LOG Indicates there is not a saving mechanism for either the device or in the management system. If the device is not reset, the entry remains in the Log Table. •• TRAP Indicates that a SNMP trap is generated, and sent via the Trap mechanism. The Trap can also be saved using the Trap mechanism. •• Both Indicates that both the Log and Trap mechanism are used to report alarms. Startup Alarm Displays the trigger that activates the alarm generation. Rising is defined by crossing the threshold from a low-value threshold to a higher-value threshold. Interval Defines the alarm interval time in seconds. Owner Displays the device or user that defined the alarm. Use the Add to List button to add the RMON Alarms Table entry. The Alarm Table area contains the following additional field: 31
-
 1
1 -
2
-
3
-
4
-
5
-
6
-
7
-
8
-
9
-
10
-
11
-
12
-
13
-
14
-
15
-
16
-
17
-
18
-
19
-
20
-
21
-
22
-
23
-
24
-
25
-
26
-
27
-
28
-
29
-
30
-
31
-
32
-
 33
33 -
 34
34 -
 35
35 -
 36
36 -
 37
37 -
 38
38 -
 39
39 -
 40
40 -
 41
41 -
 42
42 -
 43
43 -
44
-
45
-
46
-
47
-
48
-
49
-
50
-
51
-
52
-
53
-
54
-
55
-
56
-
57
-
58
-
59
-
60
-
61
-
62
-
63
-
64
-
65
-
66
-
67
-
68
-
69
-
70
-
71
-
72
-
73
-
74
-
75
-
76
-
77
-
78
-
79
-
80
-
81
-
82
-
83
-
84
-
85
-
86
-
87
-
88
-
89
-
90
-
91
-
92
-
93
-
94
-
95
-
96
 |
 |
