Cisco SRW2024P User Guide - Page 39
Statistics > RMON Events, Statistics > Port Utilization
 |
UPC - 745883571000
View all Cisco SRW2024P manuals
Add to My Manuals
Save this manual to your list of manuals |
Page 39 highlights
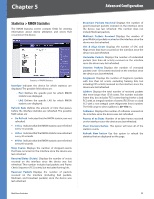
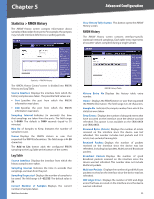
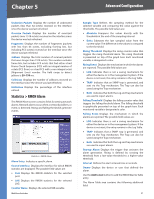
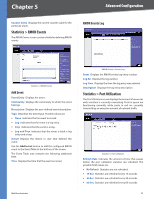
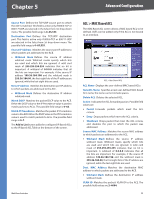
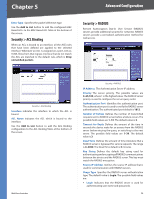
Chapter 5 Advanced Configuration Counter Value Displays the current counter value for the particular alarm. Statistics > RMON Events The RMON Events screen contains fields for defining RMON events. RMON Events Log Statistics > RMON Events Add Event Event Entry Displays the event. Community Displays the community to which the event belongs. Description Displays the user-defined event description. Type Describes the event type. Possible values are: •• None Indicates that no event occurred. •• Log Indicates that the event is a log entry. •• Trap Indicates that the event is a trap. •• Log and Trap Indicates that the event is both a log entry and a trap. Owner Displays the device or user that defined the event. Use the Add to List button to add the configured RMON event to the Event Table at the bottom of the screen. The Event Table area contains the following additional field: Time Displays the time that the event occurred. WebView Switches RMON Events > Events Log Event Displays the RMON events log entry number. Log No Displays the log number. Log Time Displays the time the log entry was entered. Description Displays the log entry description. Statistics > Port Utilization The Port Utilization screen displays the amount of resources each interface is currently consuming. Ports in green are functioning normally, while ports in red are currently transmitting an excessive amount of network traffic. Statistics > Port Utilization Refresh Rate Indicates the amount of time that passes before the port utilization statistics are refreshed. The possible field values are: •• No Refresh Statistics are not refreshed. •• 15 Sec Statistics are refreshed every 15 seconds. •• 30 Sec Statistics are refreshed every 30 seconds. •• 60 Sec Statistics are refreshed every 60 seconds. 32
-
 1
1 -
2
-
3
-
4
-
5
-
6
-
7
-
8
-
9
-
10
-
11
-
12
-
13
-
14
-
15
-
16
-
17
-
18
-
19
-
20
-
21
-
22
-
23
-
24
-
25
-
26
-
27
-
28
-
29
-
30
-
31
-
32
-
33
-
 34
34 -
 35
35 -
 36
36 -
 37
37 -
 38
38 -
 39
39 -
 40
40 -
 41
41 -
 42
42 -
 43
43 -
 44
44 -
45
-
46
-
47
-
48
-
49
-
50
-
51
-
52
-
53
-
54
-
55
-
56
-
57
-
58
-
59
-
60
-
61
-
62
-
63
-
64
-
65
-
66
-
67
-
68
-
69
-
70
-
71
-
72
-
73
-
74
-
75
-
76
-
77
-
78
-
79
-
80
-
81
-
82
-
83
-
84
-
85
-
86
-
87
-
88
-
89
-
90
-
91
-
92
-
93
-
94
-
95
-
96
 |
 |
