Garmin GPSMAP 4210 Owner's Manual - Page 63
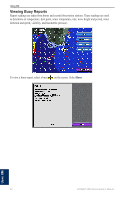
Understanding Storm Cell Information
 |
View all Garmin GPSMAP 4210 manuals
Add to My Manuals
Save this manual to your list of manuals |
Page 63 highlights
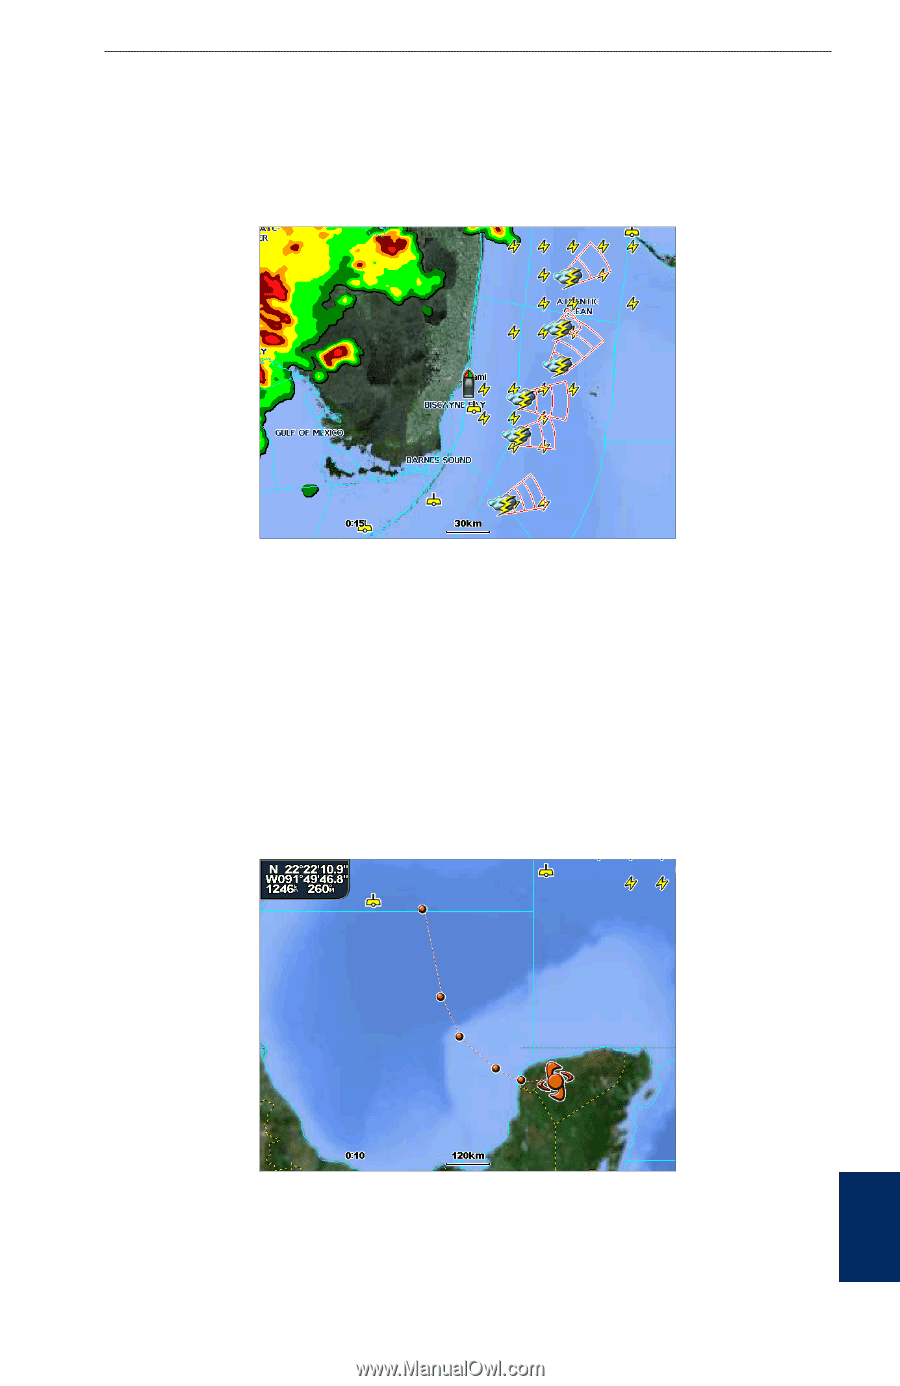
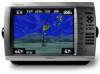
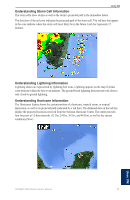
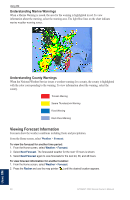
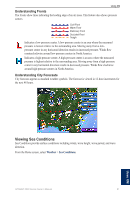
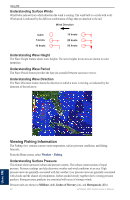
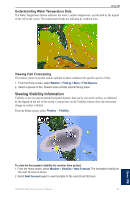
Using XM Understanding Storm Cell Information The storm cells show storms as well as the storm's projected path in the immediate future. The direction of the red cone indicates the projected path of the storm cell. The red bars that appear in the cone indicate where the storm will most likely be in the future. Each bar represents 15 minutes. Understanding Lightning Information Lightning strikes are represented by lightning bolt icons. Lightning appears on the map if strikes were detected within the last seven minutes. The ground-based lightning detection network detects only cloud-to-ground lightning. Understanding Hurricane Information The Hurricanes feature shows the current position of a hurricane, tropical storm, or tropical depression, as well as its projected path (indicated by a red line). The darkened dots on the red line display the projected locations received from the National Hurricane Center. The center provides four forecasts at 12-hour intervals (12 Hrs, 24 Hrs, 36 Hrs, and 48 Hrs), as well as the current conditions (Now). GPSMAP 4000 Series Owner's Manual 59 Using XM
-
 1
1 -
2
-
3
-
4
-
5
-
6
-
7
-
8
-
9
-
10
-
11
-
12
-
13
-
14
-
15
-
16
-
17
-
18
-
19
-
20
-
21
-
22
-
23
-
24
-
25
-
26
-
27
-
28
-
29
-
30
-
31
-
32
-
33
-
34
-
35
-
36
-
37
-
38
-
39
-
40
-
41
-
42
-
43
-
44
-
45
-
46
-
47
-
48
-
49
-
50
-
51
-
52
-
53
-
54
-
55
-
56
-
57
-
 58
58 -
 59
59 -
 60
60 -
 61
61 -
 62
62 -
 63
63 -
 64
64 -
 65
65 -
 66
66 -
 67
67 -
 68
68 -
69
-
70
-
71
-
72
-
73
-
74
-
75
-
76
-
77
-
78
-
79
-
80
-
81
-
82
-
83
-
84
 |
 |