TP-Link EAP110 EAP Controller Software V1 User Guide - Page 17
Statistics Tab - specification
 |
View all TP-Link EAP110 manuals
Add to My Manuals
Save this manual to your list of manuals |
Page 17 highlights
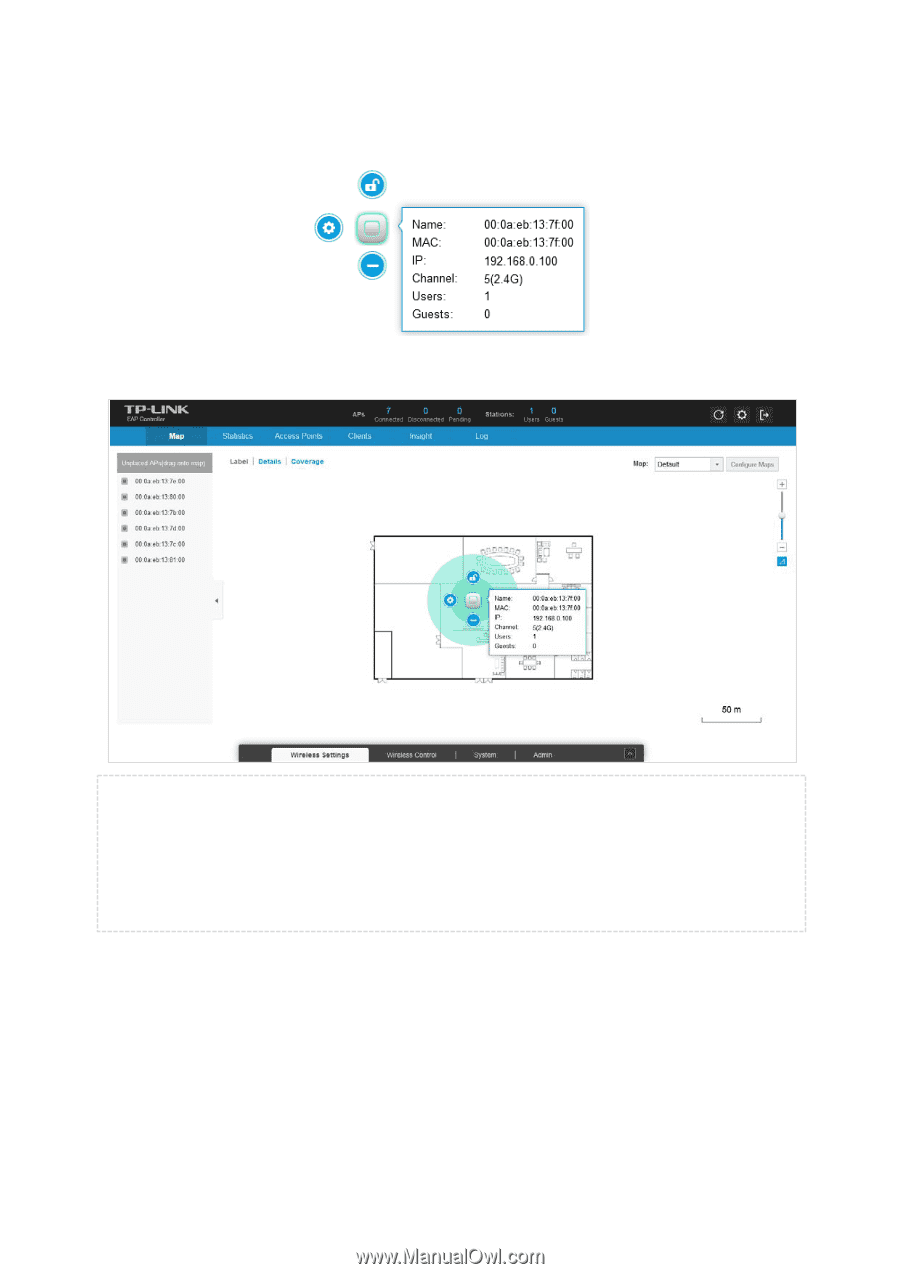
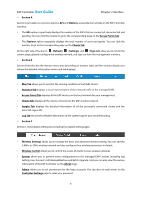
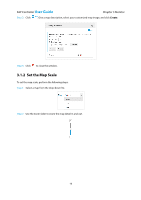
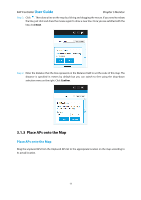
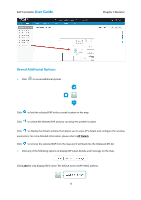
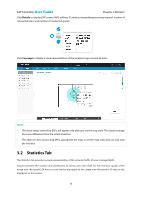
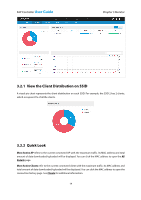
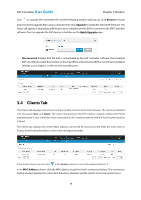
EAP Controller User Guide Chapter 3 Monitor Click Details to display EAP's name, MAC address, IP address, transmitting/receiving channel, number of connected users, and number of connected guests. Click Coverage to display a visual representation of the wireless range covered by EAPs. NOTE: The visual range covered by EAPs will appear only after you set the map scale. The visual coverage has some differences from the actual situations. The observer user cannot drag EAPs, upload/edit the map, or set the map scale, but can only view the interface. 3.2 Statistics Tab The Statistics tab provides a visual representation of the network traffic of your managed EAPs. Charts represent the number and distribution of clients over each SSID. An hour-by-hour graph of the usage over the specific 24 hours or one day-by-day graph of the usage over the specific 30 days is also displayed on this screen. 13
-
 1
1 -
2
-
3
-
4
-
5
-
6
-
7
-
8
-
9
-
10
-
11
-
 12
12 -
 13
13 -
 14
14 -
 15
15 -
 16
16 -
 17
17 -
 18
18 -
 19
19 -
 20
20 -
 21
21 -
 22
22 -
23
-
24
-
25
-
26
-
27
-
28
-
29
-
30
-
31
-
32
-
33
-
34
-
35
-
36
-
37
-
38
-
39
-
40
-
41
-
42
-
43
-
44
-
45
-
46
-
47
-
48
-
49
-
50
-
51
-
52
-
53
-
54
-
55
-
56
-
57
-
58
-
59
-
60
-
61
-
62
-
63
 |
 |