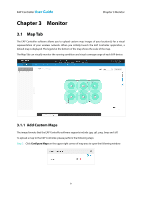
TP-Link EAP110 EAP Controller Software V1 User Guide - Page 18
View the Client Distribution on SSID, Quick Look
 |
View all TP-Link EAP110 manuals
Add to My Manuals
Save this manual to your list of manuals |
Page 18 highlights
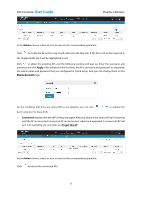
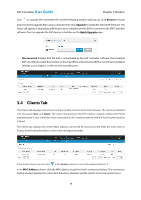
EAP Controller User Guide Chapter 3 Monitor 3.2.1 View the Client Distribution on SSID A visual pie chart represents the client distribution on each SSID. For example, the SSID 2 has 2 clients, which occupies 67% of all the clients. 3.2.2 Quick Look Most Active AP refers to the current connected AP with the maximum traffic. Its MAC address and total amount of data downloaded/uploaded will be displayed. You can click the MAC address to open the AP Details page. Most Active Clients refer to the current connected client with the maximum traffic. Its MAC address and total amount of data downloaded/uploaded will be displayed. You can click the MAC address to open the connection history page. See Clients for additional information. 14
-
 1
1 -
2
-
3
-
4
-
5
-
6
-
7
-
8
-
9
-
10
-
11
-
12
-
 13
13 -
 14
14 -
 15
15 -
 16
16 -
 17
17 -
 18
18 -
 19
19 -
 20
20 -
 21
21 -
 22
22 -
 23
23 -
24
-
25
-
26
-
27
-
28
-
29
-
30
-
31
-
32
-
33
-
34
-
35
-
36
-
37
-
38
-
39
-
40
-
41
-
42
-
43
-
44
-
45
-
46
-
47
-
48
-
49
-
50
-
51
-
52
-
53
-
54
-
55
-
56
-
57
-
58
-
59
-
60
-
61
-
62
-
63
 |
 |
EAP Controller
User Guide
Chapter 3 Monitor
14
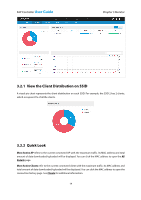
3.2.1
View the Client Distribution on SSID
A visual pie chart represents the client distribution on each SSID. For example, the SSID 2 has 2 clients,
which occupies 67% of all the clients.
3.2.2
Quick Look
Most Active AP
refers to the current connected AP with the maximum traffic. Its MAC address and total
amount of data downloaded/uploaded will be displayed. You can click the MAC address to open the
AP
Details
page.
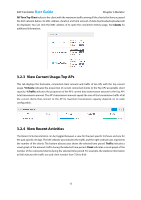
Most Active Clients
refer to the current connected client with the maximum traffic. Its MAC address and
total amount of data downloaded/uploaded will be displayed. You can click the MAC address to open the
connection history page. See
Clients
for additional information.