Dell Force10 S25-01-GE-24V FTOS 8.4.2.6 Command Line Reference Guide for the E - Page 123
Command Example: show processes cpu rp1, Example 2, Usage, Information
 |
View all Dell Force10 S25-01-GE-24V manuals
Add to My Manuals
Save this manual to your list of manuals |
Page 123 highlights
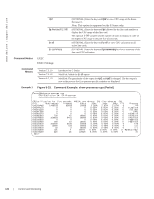
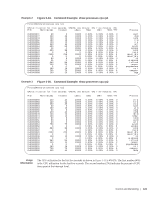
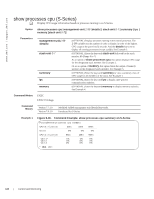
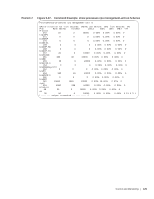
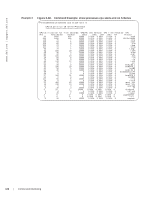
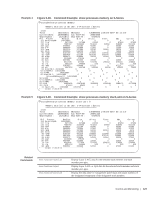
Example 2 Figure 5-34. Command Example: show processes cpu rp1 Force10#show processes cpu rp1 CPU utilization for five seconds: 0%/0%; one minute: 0%; five minutes: 0% PID Runtime(ms) Invoked uSecs 5Sec 1Min 5Min TTY 0x0000007c 0x00000077 0x00000074 0x0000006e 0x0000006b 0x00000068 0x00000064 0x00000062 0x00000024 0x00000022 0x00000020 0x00000013 0x00000006 0x00000005 0x00000004 0x00000003 0x00000002 0x00000001 0x00000000 0x00000088 60 460 100 180 100 120 690 20 880 0 2580 0 80 30 840 250 0 160 700 260 6 10000 0.00% 0.00% 0.00% 0 46 10000 0.00% 0.00% 0.00% 0 10 10000 0.00% 0.00% 0.00% 0 18 10000 0.00% 0.00% 0.00% 0 10 10000 0.00% 0.00% 0.00% 0 12 10000 0.00% 0.00% 0.00% 0 69 10000 0.00% 0.00% 0.00% 0 2 10000 0.00% 0.00% 0.00% 0 88 10000 0.00% 0.00% 0.00% 0 0 0 0.00% 0.00% 0.00% 0 258 10000 0.00% 0.00% 0.00% 0 0 0 0.00% 0.00% 0.00% 0 8 10000 0.00% 0.00% 0.00% 0 3 10000 0.00% 0.00% 0.00% 0 84 10000 0.00% 0.00% 0.00% 0 25 10000 0.00% 0.00% 0.00% 0 0 0 0.00% 0.00% 0.00% 0 16 10000 0.00% 0.00% 0.00% 0 70 10000 0.00% 0.00% 0.00% 0 26 10000 0.00% 0.00% 0.00% 0 Example 3 Figure 5-35. Command Example: show processes cpu rp2 Force10#show processes cpu rp2 CPU utilization for five seconds: 0%/0%; one minute: 0%; five minutes: 0% PID Runtime(ms) Invoked uSecs 5Sec 1Min 5Min TTY 0x00000090 0x0000008d 0x00000088 0x00000084 0x00000083 0x00000080 0x0000007b 0x00000078 0x00000074 0x00000070 0x0000006c 0x00000068 0x00000064 0x00000062 0x00000024 0x00000022 0x00000020 0x00000013 0x00000006 0x00000005 0x00000004 0x00000003 0x00000002 0x00000001 0x00000000 0x00000098 140 120 360 60 180 80 130 700 100 80 80 60 750 0 880 0 2250 0 100 0 960 140 0 160 700 140 14 10000 0.00% 0.00% 0.00% 0 12 10000 0.00% 0.00% 0.00% 0 36 10000 0.00% 0.00% 0.00% 0 6 10000 0.00% 0.00% 0.00% 0 18 10000 0.00% 0.00% 0.00% 0 8 10000 0.00% 0.00% 0.00% 0 13 10000 0.00% 0.00% 0.00% 0 70 10000 0.00% 0.00% 0.00% 0 10 10000 0.00% 0.00% 0.00% 0 8 10000 0.00% 0.00% 0.00% 0 8 10000 0.00% 0.00% 0.00% 0 6 10000 0.00% 0.00% 0.00% 0 75 10000 0.00% 0.00% 0.00% 0 0 0 0.00% 0.00% 0.00% 0 88 10000 0.00% 0.00% 0.00% 0 0 0 0.00% 0.00% 0.00% 0 225 10000 0.00% 0.00% 0.00% 0 0 0 0.00% 0.00% 0.00% 0 10 10000 0.00% 0.00% 0.00% 0 0 0 0.00% 0.00% 0.00% 0 96 10000 0.00% 0.00% 0.00% 0 14 10000 0.00% 0.00% 0.00% 0 0 0 0.00% 0.00% 0.00% 0 16 10000 0.00% 0.00% 0.00% 0 70 10000 0.00% 0.00% 0.00% 0 14 10000 0.00% 0.00% 0.00% 0 Process ospf dsm ipm1 rtm rip acl sysd1 sysmon sshd inetd mount_mfs mount_mfs sh aiodoned ioflush reaper pagedaemon init swapper bgp Process vrrp fvrp xstp span pim igmp ipm2 mrtm l2mgr l2pm arpm acl2 sysd2 sysmon sshd inetd mount_mfs mount_mfs sh aiodoned ioflush reaper pagedaemon init swapper msdp Usage Information The CPU utilization for the last five seconds as shown in Figure 5-33 is 4%/2%. The first number (4%) is the CPU utilization for the last five seconds. The second number (2%) indicates the percent of CPU time spent at the interrupt level. Control and Monitoring | 123
-
 1
1 -
2
-
3
-
4
-
5
-
6
-
7
-
8
-
9
-
10
-
11
-
12
-
13
-
14
-
15
-
16
-
17
-
18
-
19
-
20
-
21
-
22
-
23
-
24
-
25
-
26
-
27
-
28
-
29
-
30
-
31
-
32
-
33
-
34
-
35
-
36
-
37
-
38
-
39
-
40
-
41
-
42
-
43
-
44
-
45
-
46
-
47
-
48
-
49
-
50
-
51
-
52
-
53
-
54
-
55
-
56
-
57
-
58
-
59
-
60
-
61
-
62
-
63
-
64
-
65
-
66
-
67
-
68
-
69
-
70
-
71
-
72
-
73
-
74
-
75
-
76
-
77
-
78
-
79
-
80
-
81
-
82
-
83
-
84
-
85
-
86
-
87
-
88
-
89
-
90
-
91
-
92
-
93
-
94
-
95
-
96
-
97
-
98
-
99
-
100
-
101
-
102
-
103
-
104
-
105
-
106
-
107
-
108
-
109
-
110
-
111
-
112
-
113
-
114
-
115
-
116
-
117
-
 118
118 -
 119
119 -
 120
120 -
 121
121 -
 122
122 -
 123
123 -
 124
124 -
 125
125 -
 126
126 -
 127
127 -
 128
128 -
129
-
130
-
131
-
132
-
133
-
134
-
135
-
136
-
137
-
138
-
139
-
140
-
141
-
142
-
143
-
144
-
145
-
146
-
147
-
148
-
149
-
150
-
151
-
152
-
153
-
154
-
155
-
156
-
157
-
158
-
159
-
160
-
161
-
162
-
163
-
164
-
165
-
166
-
167
-
168
-
169
-
170
-
171
-
172
-
173
-
174
-
175
-
176
-
177
-
178
-
179
-
180
-
181
-
182
-
183
-
184
-
185
-
186
-
187
-
188
-
189
-
190
-
191
-
192
-
193
-
194
-
195
-
196
-
197
-
198
-
199
-
200
-
201
-
202
-
203
-
204
-
205
-
206
-
207
-
208
-
209
-
210
-
211
-
212
-
213
-
214
-
215
-
216
-
217
-
218
-
219
-
220
-
221
-
222
-
223
-
224
-
225
-
226
-
227
-
228
-
229
-
230
-
231
-
232
-
233
-
234
-
235
-
236
-
237
-
238
-
239
-
240
-
241
-
242
-
243
-
244
-
245
-
246
-
247
-
248
-
249
-
250
-
251
-
252
-
253
-
254
-
255
-
256
-
257
-
258
-
259
-
260
-
261
-
262
-
263
-
264
-
265
-
266
-
267
-
268
-
269
-
270
-
271
-
272
-
273
-
274
-
275
-
276
-
277
-
278
-
279
-
280
-
281
-
282
-
283
-
284
-
285
-
286
-
287
-
288
-
289
-
290
-
291
-
292
-
293
-
294
-
295
-
296
-
297
-
298
-
299
-
300
-
301
-
302
-
303
-
304
-
305
-
306
-
307
-
308
-
309
-
310
-
311
-
312
-
313
-
314
-
315
-
316
-
317
-
318
-
319
-
320
-
321
-
322
-
323
-
324
-
325
-
326
-
327
-
328
-
329
-
330
-
331
-
332
-
333
-
334
-
335
-
336
-
337
-
338
-
339
-
340
-
341
-
342
-
343
-
344
-
345
-
346
-
347
-
348
-
349
-
350
-
351
-
352
-
353
-
354
-
355
-
356
-
357
-
358
-
359
-
360
-
361
-
362
-
363
-
364
-
365
-
366
-
367
-
368
-
369
-
370
-
371
-
372
-
373
-
374
-
375
-
376
-
377
-
378
-
379
-
380
-
381
-
382
-
383
-
384
-
385
-
386
-
387
-
388
-
389
-
390
-
391
-
392
-
393
-
394
-
395
-
396
-
397
-
398
-
399
-
400
-
401
-
402
-
403
-
404
-
405
-
406
-
407
-
408
-
409
-
410
-
411
-
412
-
413
-
414
-
415
-
416
-
417
-
418
-
419
-
420
-
421
-
422
-
423
-
424
-
425
-
426
-
427
-
428
-
429
-
430
-
431
-
432
-
433
-
434
-
435
-
436
-
437
-
438
-
439
-
440
-
441
-
442
-
443
-
444
-
445
-
446
-
447
-
448
-
449
-
450
-
451
-
452
-
453
-
454
-
455
-
456
-
457
-
458
-
459
-
460
-
461
-
462
-
463
-
464
-
465
-
466
-
467
-
468
-
469
-
470
-
471
-
472
-
473
-
474
-
475
-
476
-
477
-
478
-
479
-
480
-
481
-
482
-
483
-
484
-
485
-
486
-
487
-
488
-
489
-
490
-
491
-
492
-
493
-
494
-
495
-
496
-
497
-
498
-
499
-
500
-
501
-
502
-
503
-
504
-
505
-
506
-
507
-
508
-
509
-
510
-
511
-
512
-
513
-
514
-
515
-
516
-
517
-
518
-
519
-
520
-
521
-
522
-
523
-
524
-
525
-
526
-
527
-
528
-
529
-
530
-
531
-
532
-
533
-
534
-
535
-
536
-
537
-
538
-
539
-
540
-
541
-
542
-
543
-
544
-
545
-
546
-
547
-
548
-
549
-
550
-
551
-
552
-
553
-
554
-
555
-
556
-
557
-
558
-
559
-
560
-
561
-
562
-
563
-
564
-
565
-
566
-
567
-
568
-
569
-
570
-
571
-
572
-
573
-
574
-
575
-
576
-
577
-
578
-
579
-
580
-
581
-
582
-
583
-
584
-
585
-
586
-
587
-
588
-
589
-
590
-
591
-
592
-
593
-
594
-
595
-
596
-
597
-
598
-
599
-
600
-
601
-
602
-
603
-
604
-
605
-
606
-
607
-
608
-
609
-
610
-
611
-
612
-
613
-
614
-
615
-
616
-
617
-
618
-
619
-
620
-
621
-
622
-
623
-
624
-
625
-
626
-
627
-
628
-
629
-
630
-
631
-
632
-
633
-
634
-
635
-
636
-
637
-
638
-
639
-
640
-
641
-
642
-
643
-
644
-
645
-
646
-
647
-
648
-
649
-
650
-
651
-
652
-
653
-
654
-
655
-
656
-
657
-
658
-
659
-
660
-
661
-
662
-
663
-
664
-
665
-
666
-
667
-
668
-
669
-
670
-
671
-
672
-
673
-
674
-
675
-
676
-
677
-
678
-
679
-
680
-
681
-
682
-
683
-
684
-
685
-
686
-
687
-
688
-
689
-
690
-
691
-
692
-
693
-
694
-
695
-
696
-
697
-
698
-
699
-
700
-
701
-
702
-
703
-
704
-
705
-
706
-
707
-
708
-
709
-
710
-
711
-
712
-
713
-
714
-
715
-
716
-
717
-
718
-
719
-
720
-
721
-
722
-
723
-
724
-
725
-
726
-
727
-
728
-
729
-
730
-
731
-
732
-
733
-
734
-
735
-
736
-
737
-
738
-
739
-
740
-
741
-
742
-
743
-
744
-
745
-
746
-
747
-
748
-
749
-
750
-
751
-
752
-
753
-
754
-
755
-
756
-
757
-
758
-
759
-
760
-
761
-
762
-
763
-
764
-
765
-
766
-
767
-
768
-
769
-
770
-
771
-
772
-
773
-
774
-
775
-
776
-
777
-
778
-
779
-
780
-
781
-
782
-
783
-
784
-
785
-
786
-
787
-
788
-
789
-
790
-
791
-
792
-
793
-
794
-
795
-
796
-
797
-
798
-
799
-
800
-
801
-
802
-
803
-
804
-
805
-
806
-
807
-
808
-
809
-
810
-
811
-
812
-
813
-
814
-
815
-
816
-
817
-
818
-
819
-
820
-
821
-
822
-
823
-
824
-
825
-
826
-
827
-
828
-
829
-
830
-
831
-
832
-
833
-
834
-
835
-
836
-
837
-
838
-
839
-
840
-
841
-
842
-
843
-
844
-
845
-
846
-
847
-
848
-
849
-
850
-
851
-
852
-
853
-
854
-
855
-
856
-
857
-
858
-
859
-
860
-
861
-
862
-
863
-
864
-
865
-
866
-
867
-
868
-
869
-
870
-
871
-
872
-
873
-
874
-
875
-
876
-
877
-
878
-
879
-
880
-
881
-
882
-
883
-
884
-
885
-
886
-
887
-
888
-
889
-
890
-
891
-
892
-
893
-
894
-
895
-
896
-
897
-
898
-
899
-
900
-
901
-
902
-
903
-
904
-
905
-
906
-
907
-
908
-
909
-
910
-
911
-
912
-
913
-
914
-
915
-
916
-
917
-
918
-
919
-
920
-
921
-
922
-
923
-
924
-
925
-
926
-
927
-
928
-
929
-
930
-
931
-
932
-
933
-
934
-
935
-
936
-
937
-
938
-
939
-
940
-
941
-
942
-
943
-
944
-
945
-
946
-
947
-
948
-
949
-
950
-
951
-
952
-
953
-
954
-
955
-
956
-
957
-
958
-
959
-
960
-
961
-
962
-
963
-
964
-
965
-
966
-
967
-
968
-
969
-
970
-
971
-
972
-
973
-
974
-
975
-
976
-
977
-
978
-
979
-
980
-
981
-
982
-
983
-
984
-
985
-
986
-
987
-
988
-
989
-
990
-
991
-
992
-
993
-
994
-
995
-
996
-
997
-
998
-
999
-
1,000
-
1,001
-
1,002
-
1,003
-
1,004
-
1,005
-
1,006
-
1,007
-
1,008
-
1,009
-
1,010
-
1,011
-
1,012
-
1,013
-
1,014
-
1,015
-
1,016
-
1,017
-
1,018
-
1,019
-
1,020
-
1,021
-
1,022
-
1,023
-
1,024
-
1,025
-
1,026
-
1,027
-
1,028
-
1,029
-
1,030
-
1,031
-
1,032
-
1,033
-
1,034
-
1,035
-
1,036
-
1,037
-
1,038
-
1,039
-
1,040
-
1,041
-
1,042
-
1,043
-
1,044
-
1,045
-
1,046
-
1,047
-
1,048
-
1,049
-
1,050
-
1,051
-
1,052
-
1,053
-
1,054
-
1,055
-
1,056
-
1,057
-
1,058
-
1,059
-
1,060
-
1,061
-
1,062
-
1,063
-
1,064
-
1,065
-
1,066
-
1,067
-
1,068
-
1,069
-
1,070
-
1,071
-
1,072
-
1,073
-
1,074
-
1,075
-
1,076
-
1,077
-
1,078
-
1,079
-
1,080
-
1,081
-
1,082
-
1,083
-
1,084
-
1,085
-
1,086
-
1,087
-
1,088
-
1,089
-
1,090
-
1,091
-
1,092
-
1,093
-
1,094
-
1,095
-
1,096
-
1,097
-
1,098
-
1,099
-
1,100
-
1,101
-
1,102
-
1,103
-
1,104
-
1,105
-
1,106
-
1,107
-
1,108
-
1,109
-
1,110
-
1,111
-
1,112
-
1,113
-
1,114
-
1,115
-
1,116
-
1,117
-
1,118
-
1,119
-
1,120
-
1,121
-
1,122
-
1,123
-
1,124
-
1,125
-
1,126
-
1,127
-
1,128
-
1,129
-
1,130
-
1,131
-
1,132
-
1,133
-
1,134
-
1,135
-
1,136
-
1,137
-
1,138
-
1,139
-
1,140
-
1,141
-
1,142
-
1,143
-
1,144
-
1,145
-
1,146
-
1,147
-
1,148
-
1,149
-
1,150
-
1,151
-
1,152
-
1,153
-
1,154
-
1,155
-
1,156
-
1,157
-
1,158
-
1,159
-
1,160
-
1,161
-
1,162
-
1,163
-
1,164
-
1,165
-
1,166
-
1,167
-
1,168
-
1,169
-
1,170
-
1,171
-
1,172
-
1,173
-
1,174
-
1,175
-
1,176
-
1,177
-
1,178
-
1,179
-
1,180
-
1,181
-
1,182
-
1,183
-
1,184
-
1,185
-
1,186
-
1,187
-
1,188
-
1,189
-
1,190
-
1,191
-
1,192
-
1,193
-
1,194
-
1,195
-
1,196
-
1,197
-
1,198
-
1,199
-
1,200
-
1,201
-
1,202
-
1,203
-
1,204
-
1,205
-
1,206
-
1,207
-
1,208
-
1,209
-
1,210
-
1,211
-
1,212
-
1,213
-
1,214
-
1,215
-
1,216
-
1,217
-
1,218
-
1,219
-
1,220
-
1,221
-
1,222
-
1,223
-
1,224
-
1,225
-
1,226
-
1,227
-
1,228
-
1,229
-
1,230
-
1,231
-
1,232
-
1,233
-
1,234
-
1,235
-
1,236
-
1,237
-
1,238
-
1,239
-
1,240
-
1,241
-
1,242
-
1,243
-
1,244
-
1,245
-
1,246
-
1,247
-
1,248
-
1,249
-
1,250
-
1,251
-
1,252
-
1,253
-
1,254
-
1,255
-
1,256
-
1,257
-
1,258
-
1,259
-
1,260
-
1,261
-
1,262
-
1,263
-
1,264
-
1,265
-
1,266
-
1,267
-
1,268
-
1,269
-
1,270
-
1,271
-
1,272
-
1,273
-
1,274
-
1,275
-
1,276
-
1,277
-
1,278
-
1,279
-
1,280
-
1,281
-
1,282
-
1,283
-
1,284
-
1,285
-
1,286
-
1,287
-
1,288
-
1,289
-
1,290
-
1,291
-
1,292
-
1,293
-
1,294
-
1,295
-
1,296
-
1,297
-
1,298
-
1,299
-
1,300
-
1,301
-
1,302
-
1,303
-
1,304
-
1,305
-
1,306
-
1,307
-
1,308
-
1,309
-
1,310
-
1,311
-
1,312
-
1,313
-
1,314
-
1,315
-
1,316
-
1,317
-
1,318
-
1,319
-
1,320
-
1,321
-
1,322
-
1,323
-
1,324
-
1,325
-
1,326
-
1,327
-
1,328
-
1,329
-
1,330
-
1,331
-
1,332
-
1,333
-
1,334
-
1,335
-
1,336
-
1,337
-
1,338
-
1,339
-
1,340
-
1,341
-
1,342
-
1,343
-
1,344
-
1,345
-
1,346
-
1,347
-
1,348
-
1,349
-
1,350
-
1,351
-
1,352
-
1,353
-
1,354
-
1,355
-
1,356
-
1,357
-
1,358
-
1,359
-
1,360
-
1,361
-
1,362
-
1,363
-
1,364
-
1,365
-
1,366
-
1,367
-
1,368
-
1,369
-
1,370
-
1,371
-
1,372
-
1,373
-
1,374
-
1,375
-
1,376
-
1,377
-
1,378
-
1,379
-
1,380
-
1,381
-
1,382
-
1,383
-
1,384
-
1,385
-
1,386
-
1,387
-
1,388
-
1,389
-
1,390
-
1,391
-
1,392
-
1,393
-
1,394
-
1,395
-
1,396
-
1,397
-
1,398
-
1,399
-
1,400
-
1,401
-
1,402
-
1,403
-
1,404
-
1,405
-
1,406
-
1,407
-
1,408
-
1,409
-
1,410
-
1,411
-
1,412
-
1,413
-
1,414
-
1,415
-
1,416
-
1,417
-
1,418
-
1,419
-
1,420
-
1,421
-
1,422
-
1,423
-
1,424
-
1,425
-
1,426
-
1,427
-
1,428
-
1,429
-
1,430
-
1,431
-
1,432
-
1,433
-
1,434
-
1,435
-
1,436
-
1,437
-
1,438
-
1,439
-
1,440
-
1,441
-
1,442
-
1,443
-
1,444
-
1,445
-
1,446
-
1,447
-
1,448
-
1,449
-
1,450
-
1,451
-
1,452
-
1,453
-
1,454
-
1,455
-
1,456
-
1,457
-
1,458
-
1,459
-
1,460
-
1,461
-
1,462
-
1,463
-
1,464
-
1,465
-
1,466
-
1,467
-
1,468
-
1,469
-
1,470
-
1,471
-
1,472
-
1,473
-
1,474
-
1,475
-
1,476
-
1,477
-
1,478
-
1,479
-
1,480
-
1,481
-
1,482
-
1,483
-
1,484
-
1,485
-
1,486
-
1,487
-
1,488
-
1,489
-
1,490
-
1,491
-
1,492
-
1,493
-
1,494
-
1,495
-
1,496
-
1,497
-
1,498
-
1,499
-
1,500
-
1,501
-
1,502
-
1,503
-
1,504
-
1,505
-
1,506
-
1,507
-
1,508
-
1,509
-
1,510
-
1,511
-
1,512
-
1,513
-
1,514
-
1,515
-
1,516
-
1,517
-
1,518
-
1,519
-
1,520
-
1,521
-
1,522
-
1,523
-
1,524
-
1,525
-
1,526
-
1,527
-
1,528
-
1,529
-
1,530
-
1,531
-
1,532
-
1,533
-
1,534
-
1,535
-
1,536
-
1,537
-
1,538
-
1,539
-
1,540
-
1,541
-
1,542
-
1,543
-
1,544
-
1,545
-
1,546
-
1,547
-
1,548
-
1,549
-
1,550
-
1,551
-
1,552
-
1,553
-
1,554
-
1,555
-
1,556
-
1,557
-
1,558
-
1,559
-
1,560
-
1,561
-
1,562
-
1,563
-
1,564
-
1,565
-
1,566
-
1,567
-
1,568
-
1,569
-
1,570
-
1,571
-
1,572
-
1,573
-
1,574
-
1,575
-
1,576
-
1,577
-
1,578
-
1,579
-
1,580
-
1,581
-
1,582
-
1,583
-
1,584
-
1,585
-
1,586
-
1,587
-
1,588
-
1,589
-
1,590
-
1,591
-
1,592
-
1,593
-
1,594
-
1,595
-
1,596
-
1,597
-
1,598
-
1,599
-
1,600
-
1,601
-
1,602
-
1,603
-
1,604
-
1,605
-
1,606
-
1,607
-
1,608
-
1,609
-
1,610
-
1,611
-
1,612
-
1,613
-
1,614
-
1,615
-
1,616
-
1,617
-
1,618
-
1,619
-
1,620
-
1,621
-
1,622
-
1,623
-
1,624
-
1,625
-
1,626
-
1,627
-
1,628
-
1,629
-
1,630
-
1,631
-
1,632
-
1,633
-
1,634
-
1,635
-
1,636
-
1,637
-
1,638
-
1,639
-
1,640
-
1,641
-
1,642
-
1,643
-
1,644
-
1,645
-
1,646
-
1,647
-
1,648
-
1,649
-
1,650
-
1,651
-
1,652
-
1,653
-
1,654
-
1,655
-
1,656
-
1,657
-
1,658
-
1,659
-
1,660
-
1,661
-
1,662
-
1,663
-
1,664
-
1,665
-
1,666
-
1,667
-
1,668
-
1,669
-
1,670
-
1,671
-
1,672
-
1,673
-
1,674
-
1,675
-
1,676
-
1,677
-
1,678
-
1,679
-
1,680
-
1,681
-
1,682
-
1,683
-
1,684
-
1,685
-
1,686
 |
 |
