HP 30b HP 20b Business Consultant and HP 30b Business Professional User's Guid - Page 45
Cash Flows
 |
View all HP 30b manuals
Add to My Manuals
Save this manual to your list of manuals |
Page 45 highlights
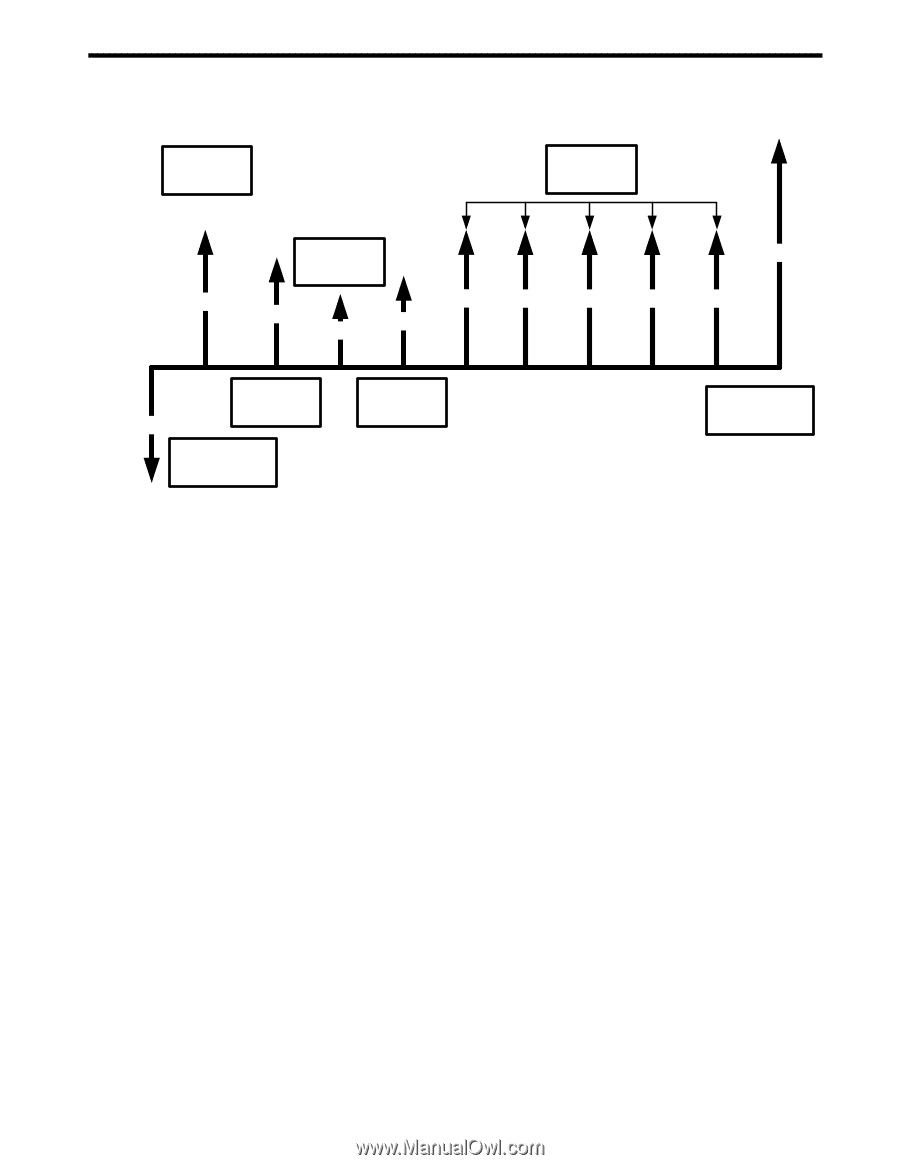
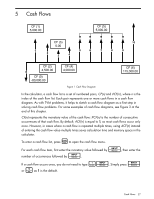
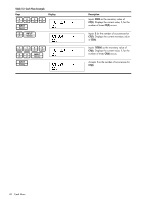
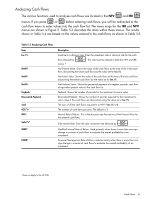
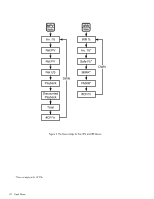
5 Cash Flows CF (1) 5,000.00 CF (5) 5,000.00 CF (3) 10 0.00 1 5 6 7 8 9 2 3 4 CF (2) 4,500.00 0 CF (0) -80,000.00 CF (4) 4,000.00 CF (6) 115,000.00 Figure 1 Cash Flow Diagram In the calculator, a cash flow list is a set of numbered pairs, CF(n) and #CF(n), where n is the index of the cash flow list. Each pair represents one or more cash flows in a cash flow diagram. As with TVM problems, it helps to sketch a cash flow diagram as a first step in solving cash flow problems. For some examples of cash flow diagrams, see Figure 3 at the end of this chapter. CF(n) represents the monetary value of the cash flow; #CF(n) is the number of consecutive occurrences of that cash flow. By default, #CF(n) is equal to 1, as most cash flows occur only once. However, in cases where a cash flow is repeated multiple times, using #CF(n) instead of entering the cash flow value multiple times saves calculation time and memory space in the calculator. C To enter a cash flow list, press to open the cash flow menu. I For each cash flow item, first enter the monetary value followed by , then enter the I number of occurrences followed by . 1I I If a cash flow occurs once, you do not need to type . Simply press < or as 1 is the default. Cash Flows 37
-
 1
1 -
2
-
3
-
4
-
5
-
6
-
7
-
8
-
9
-
10
-
11
-
12
-
13
-
14
-
15
-
16
-
17
-
18
-
19
-
20
-
21
-
22
-
23
-
24
-
25
-
26
-
27
-
28
-
29
-
30
-
31
-
32
-
33
-
34
-
35
-
36
-
37
-
38
-
39
-
 40
40 -
 41
41 -
 42
42 -
 43
43 -
 44
44 -
 45
45 -
 46
46 -
 47
47 -
 48
48 -
 49
49 -
 50
50 -
51
-
52
-
53
-
54
-
55
-
56
-
57
-
58
-
59
-
60
-
61
-
62
-
63
-
64
-
65
-
66
-
67
-
68
-
69
-
70
-
71
-
72
-
73
-
74
-
75
-
76
-
77
-
78
-
79
-
80
-
81
-
82
-
83
-
84
-
85
-
86
-
87
-
88
-
89
-
90
-
91
-
92
-
93
-
94
-
95
-
96
-
97
-
98
-
99
-
100
-
101
-
102
-
103
-
104
-
105
-
106
-
107
-
108
-
109
-
110
-
111
-
112
-
113
-
114
 |
 |