HP 30b HP 20b Business Consultant and HP 30b Business Professional User's Guid - Page 79
The Statistics Menu Items, Population Dev
 |
View all HP 30b manuals
Add to My Manuals
Save this manual to your list of manuals |
Page 79 highlights
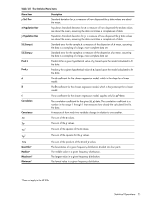
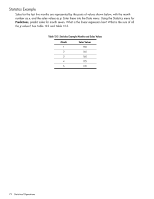
Table 12-1 The Statistics Menu Items Menu Item y Std. Dev x Population Dev y Population Dev S.E.Samp.x S.E.Samp.y Pred x Pred y a b c Correlation Covariance Σx Σy Σx2 Σy2 Σxy Description Standard deviation for y: a measure of how dispersed the y data values are about the mean. Population Standard deviation for x: a measure of how dispersed the x data values are about the mean, assuming the data constitutes a complete set of data. Population Standard deviation for y: a measure of how dispersed the y data values are about the mean, assuming the data constitutes a complete set of data. Standard error for the sample x: a measure of the dispersion of x mean, assuming the data is a sampling of a large, more complete data set. Standard error for the sample y: a measure of the dispersion of y mean, assuming the data is a sampling of a large, more complete data set. Predicts x for a given hypothetical value of y, based upon the model calculated to fit the data. Predicts y for a given hypothetical value of x, based upon the model calculated to fit the data. The a coefficient for the chosen regression model, which is the slope for a linear model. The b coefficient for the chosen regression model, which is the y-intercept for a linear model. The c coefficient for the chosen regression model, applies only for ax2+bx+c. The correlation coefficient for the given (x, y) data. The correlation coefficient is a number in the range -1 through 1 that measures how closely the calculated line fits the data. A measure of how much two variables change in relation to one another. The sum of the x values. The sum of the y values. The sum of the squares of the x values. The sum of the squares for the y values. The sum of the products of the x and y values. Quartiles* Median* Maximum* Minimum* The boundaries of a given frequency distribution divided into four parts. The middle value in a given frequency distribution. The largest value in a given frequency distribution. The lowest value in a given frequency distribution. *Does not apply to the HP 20b. Statistical Operations 71
-
 1
1 -
2
-
3
-
4
-
5
-
6
-
7
-
8
-
9
-
10
-
11
-
12
-
13
-
14
-
15
-
16
-
17
-
18
-
19
-
20
-
21
-
22
-
23
-
24
-
25
-
26
-
27
-
28
-
29
-
30
-
31
-
32
-
33
-
34
-
35
-
36
-
37
-
38
-
39
-
40
-
41
-
42
-
43
-
44
-
45
-
46
-
47
-
48
-
49
-
50
-
51
-
52
-
53
-
54
-
55
-
56
-
57
-
58
-
59
-
60
-
61
-
62
-
63
-
64
-
65
-
66
-
67
-
68
-
69
-
70
-
71
-
72
-
73
-
 74
74 -
 75
75 -
 76
76 -
 77
77 -
 78
78 -
 79
79 -
 80
80 -
 81
81 -
 82
82 -
 83
83 -
 84
84 -
85
-
86
-
87
-
88
-
89
-
90
-
91
-
92
-
93
-
94
-
95
-
96
-
97
-
98
-
99
-
100
-
101
-
102
-
103
-
104
-
105
-
106
-
107
-
108
-
109
-
110
-
111
-
112
-
113
-
114
 |
 |
