HP 30b HP 20b Business Consultant and HP 30b Business Professional User's Guid - Page 80
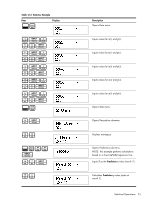
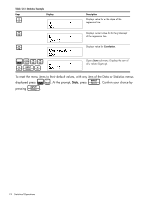
Statistics Example, Enter these into the Data menu. Using the Statistics menu
 |
View all HP 30b manuals
Add to My Manuals
Save this manual to your list of manuals |
Page 80 highlights
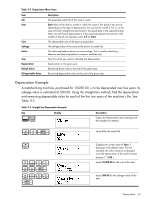
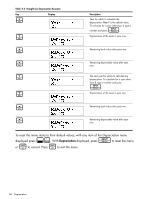
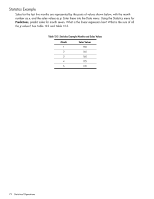
Statistics Example Sales for the last five months are represented by the pairs of values shown below, with the month number as x, and the sales values as y. Enter these into the Data menu. Using the Statistics menu for Predictions, predict sales for month seven. What is the linear regression line? What is the sum of all the y values? See Table 12-2 and Table 12-3. Table 12-2 Statistics Example Months and Sales Values Month 1 2 3 4 5 Sales Values 150 165 160 175 170 72 Statistical Operations
-
 1
1 -
2
-
3
-
4
-
5
-
6
-
7
-
8
-
9
-
10
-
11
-
12
-
13
-
14
-
15
-
16
-
17
-
18
-
19
-
20
-
21
-
22
-
23
-
24
-
25
-
26
-
27
-
28
-
29
-
30
-
31
-
32
-
33
-
34
-
35
-
36
-
37
-
38
-
39
-
40
-
41
-
42
-
43
-
44
-
45
-
46
-
47
-
48
-
49
-
50
-
51
-
52
-
53
-
54
-
55
-
56
-
57
-
58
-
59
-
60
-
61
-
62
-
63
-
64
-
65
-
66
-
67
-
68
-
69
-
70
-
71
-
72
-
73
-
74
-
 75
75 -
 76
76 -
 77
77 -
 78
78 -
 79
79 -
 80
80 -
 81
81 -
 82
82 -
 83
83 -
 84
84 -
 85
85 -
86
-
87
-
88
-
89
-
90
-
91
-
92
-
93
-
94
-
95
-
96
-
97
-
98
-
99
-
100
-
101
-
102
-
103
-
104
-
105
-
106
-
107
-
108
-
109
-
110
-
111
-
112
-
113
-
114
 |
 |

Statistical Operations
72
Statistics Example
Sales for the last five months are represented by the pairs of values shown below, with the month
number as
x
, and the sales values as
y
. Enter these into the Data menu. Using the Statistics menu for
Predictions
, predict sales for month seven. What is the linear regression line? What is the sum of all
the
y
values? See Table 12-2 and Table12-3.
Table 12-2
Statistics Example Months and Sales Values
Month
Sales Values
1
150
2
165
3
160
4
175
5
170