HP 30b HP 20b Business Consultant and HP 30b Business Professional User's Guid - Page 62
Black-Scholes Example, Statistical Operations - and statistics
 |
View all HP 30b manuals
Add to My Manuals
Save this manual to your list of manuals |
Page 62 highlights
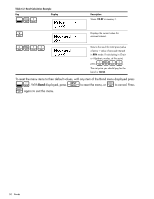
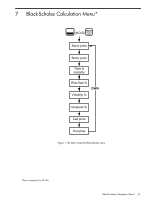
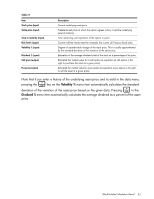
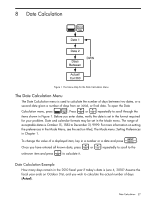
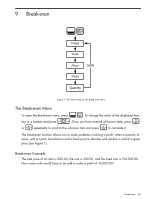
Black-Scholes Example The historic prices for an asset and their dividends are listed in Table 7-2 below. Given this data, calculate the call and put prices for the asset. The example is calculated with RPN set as the operating mode. First, enter the historical asset prices and the dividend as ordered pairs in the Data menu. Enter the historical prices for the x values, and the dividend for each y value. For more information about entering data in the Data menu, see Chapter 12, Statistical Operations. Table 7-2 Historical Asset Price (x) 80 85 78 72 Dividend (y) 3 5 1 0 < > Open the Black-Scholes menu. Use the arrow keys, or , to scroll through the menu. With the menu item displayed, key in the value in the right column of the table followed by I: Table 7-3 Menu item Stock Price Strike Price Time to Maturity Risk Free% Volatility% Dividend% Value 74 72 0.3 (years) 5 8.21 2.73 54 Black-Scholes Calculation Menu*
-
 1
1 -
2
-
3
-
4
-
5
-
6
-
7
-
8
-
9
-
10
-
11
-
12
-
13
-
14
-
15
-
16
-
17
-
18
-
19
-
20
-
21
-
22
-
23
-
24
-
25
-
26
-
27
-
28
-
29
-
30
-
31
-
32
-
33
-
34
-
35
-
36
-
37
-
38
-
39
-
40
-
41
-
42
-
43
-
44
-
45
-
46
-
47
-
48
-
49
-
50
-
51
-
52
-
53
-
54
-
55
-
56
-
 57
57 -
 58
58 -
 59
59 -
 60
60 -
 61
61 -
 62
62 -
 63
63 -
 64
64 -
 65
65 -
 66
66 -
 67
67 -
68
-
69
-
70
-
71
-
72
-
73
-
74
-
75
-
76
-
77
-
78
-
79
-
80
-
81
-
82
-
83
-
84
-
85
-
86
-
87
-
88
-
89
-
90
-
91
-
92
-
93
-
94
-
95
-
96
-
97
-
98
-
99
-
100
-
101
-
102
-
103
-
104
-
105
-
106
-
107
-
108
-
109
-
110
-
111
-
112
-
113
-
114
 |
 |