HP 30b HP 20b Business Consultant and HP 30b Business Professional User's Guid - Page 49
Analyzing Cash Flows, before entering cash flows, you will be redirected to
 |
View all HP 30b manuals
Add to My Manuals
Save this manual to your list of manuals |
Page 49 highlights
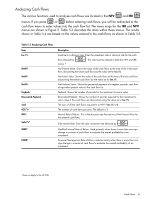
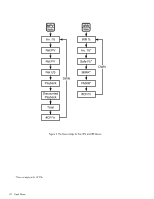
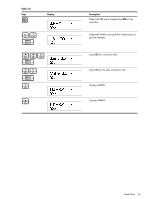
Analyzing Cash Flows P R The various functions used to analyze cash flows are located in the NPV and IRR R P menus. If you press or before entering cash flows, you will be redirected to the cash flow menu to enter values into the cash flow list. The menu maps for the IRR and NPV menus are shown in Figure 2. Table 5-3 describes the items within these menus. The results shown in Table 5-4 are based on the values entered in the cash flows as shown in Table 5-2. Table 5-3 Analyzing Cash Flows Item Inv. l% NetPV NetFV NetUS Payback Discounted Payback Total #CF/Yr IRR% Safe I%* MIRR* FMRR* Description Investment or discount rate. Enter the investment rate or discount rate for the cash I flow followed by . This rate must be entered in both the NPV and IRR menus.* Net Present Value. Shows the value of the cash flows at the time of the initial cash flow, discounting the future cash flows by the value set for Inv. I%. Net Future Value. Shows the value of the cash flows at the time of the last cash flow, discounting the earlier cash flows by the value set for Inv. I%. Net Uniform Series. Shows the per-period payment of a regular, periodic cash flow of equivalent present value to the cash flow list. Payback. Shows the number of periods for the investment to return value. Discounted Payback. Shows the number of periods required for the investment to return value if the cash flows are discounted using the value set in Inv. I%. The sum of all the cash flows, equivalent to NPV if Inv. I% is 0. The number of cash flows per year. The default is 1. Internal Rate of Return. This is the discount rate that returns a Net Present Value for the entered cash flows. I Safe Interest Rate. Enter the safe investment rate followed by . Modified Internal Rate of Return. Used primarily when there is more than one sign change in a series of cash flows to evaluate the overall profitability of an investment. Financial Management Rate of Return. Used primarily when there is more than one sign change in a series of cash flows to evaluate the overall profitability of an investment. *Does not apply to the HP 20b. Cash Flows 41
-
 1
1 -
2
-
3
-
4
-
5
-
6
-
7
-
8
-
9
-
10
-
11
-
12
-
13
-
14
-
15
-
16
-
17
-
18
-
19
-
20
-
21
-
22
-
23
-
24
-
25
-
26
-
27
-
28
-
29
-
30
-
31
-
32
-
33
-
34
-
35
-
36
-
37
-
38
-
39
-
40
-
41
-
42
-
43
-
 44
44 -
 45
45 -
 46
46 -
 47
47 -
 48
48 -
 49
49 -
 50
50 -
 51
51 -
 52
52 -
 53
53 -
 54
54 -
55
-
56
-
57
-
58
-
59
-
60
-
61
-
62
-
63
-
64
-
65
-
66
-
67
-
68
-
69
-
70
-
71
-
72
-
73
-
74
-
75
-
76
-
77
-
78
-
79
-
80
-
81
-
82
-
83
-
84
-
85
-
86
-
87
-
88
-
89
-
90
-
91
-
92
-
93
-
94
-
95
-
96
-
97
-
98
-
99
-
100
-
101
-
102
-
103
-
104
-
105
-
106
-
107
-
108
-
109
-
110
-
111
-
112
-
113
-
114
 |
 |