HP StorageWorks 16-EL HP StorageWorks Web Tools V3.1.x/4.1.x User Guide (AA-RS - Page 160
Table 38: Display Resource Usage, Print All Graphs
 |
View all HP StorageWorks 16-EL manuals
Add to My Manuals
Save this manual to your list of manuals |
Page 160 highlights
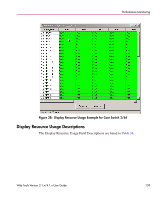
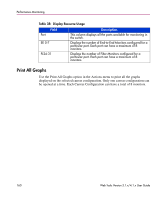
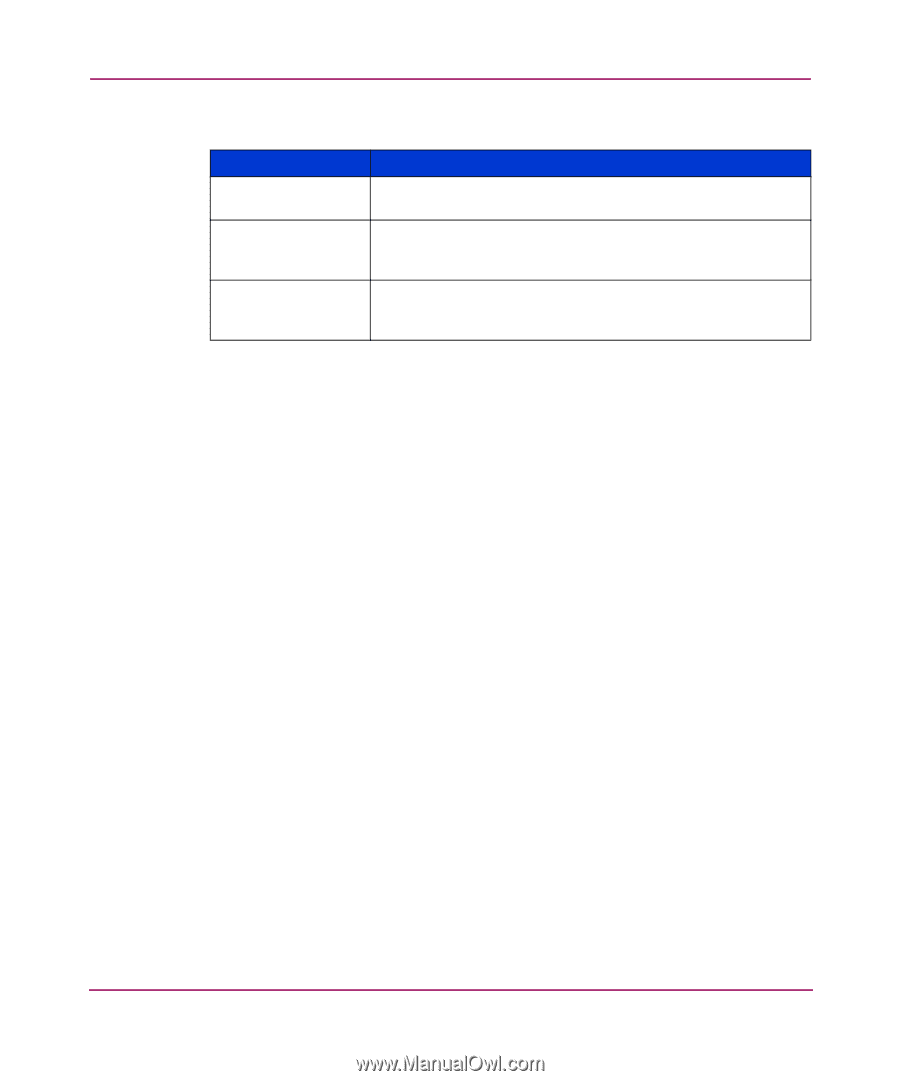
Performance Monitoring Table 38: Display Resource Usage Field Port EE 0-7 FL24-31 Description This column displays all the ports available for monitoring in the switch. Displays the number of End-to-End Monitors configured for a particular port. Each port can have a maximum of 8 monitors. Displays the number of Filter Monitors configured for a particular port. Each port can have a maximum of 8 monitors. Print All Graphs Use the Print All Graphs option in the Actions menu to print all the graphs displayed on the selected canvas configuration. Only one canvas configuration can be opened at a time. Each Canvas Configuration can have a total of 8 monitors. 160 Web Tools Version 3.1.x/4.1.x User Guide
-
 1
1 -
2
-
3
-
4
-
5
-
6
-
7
-
8
-
9
-
10
-
11
-
12
-
13
-
14
-
15
-
16
-
17
-
18
-
19
-
20
-
21
-
22
-
23
-
24
-
25
-
26
-
27
-
28
-
29
-
30
-
31
-
32
-
33
-
34
-
35
-
36
-
37
-
38
-
39
-
40
-
41
-
42
-
43
-
44
-
45
-
46
-
47
-
48
-
49
-
50
-
51
-
52
-
53
-
54
-
55
-
56
-
57
-
58
-
59
-
60
-
61
-
62
-
63
-
64
-
65
-
66
-
67
-
68
-
69
-
70
-
71
-
72
-
73
-
74
-
75
-
76
-
77
-
78
-
79
-
80
-
81
-
82
-
83
-
84
-
85
-
86
-
87
-
88
-
89
-
90
-
91
-
92
-
93
-
94
-
95
-
96
-
97
-
98
-
99
-
100
-
101
-
102
-
103
-
104
-
105
-
106
-
107
-
108
-
109
-
110
-
111
-
112
-
113
-
114
-
115
-
116
-
117
-
118
-
119
-
120
-
121
-
122
-
123
-
124
-
125
-
126
-
127
-
128
-
129
-
130
-
131
-
132
-
133
-
134
-
135
-
136
-
137
-
138
-
139
-
140
-
141
-
142
-
143
-
144
-
145
-
146
-
147
-
148
-
149
-
150
-
151
-
152
-
153
-
154
-
 155
155 -
 156
156 -
 157
157 -
 158
158 -
 159
159 -
 160
160 -
 161
161 -
 162
162 -
 163
163 -
 164
164 -
 165
165 -
166
-
167
-
168
-
169
-
170
-
171
-
172
-
173
-
174
-
175
-
176
-
177
-
178
-
179
-
180
-
181
-
182
-
183
-
184
-
185
-
186
-
187
-
188
-
189
-
190
-
191
-
192
-
193
-
194
-
195
-
196
-
197
-
198
-
199
-
200
-
201
-
202
-
203
-
204
-
205
-
206
-
207
-
208
-
209
-
210
-
211
-
212
-
213
-
214
-
215
-
216
-
217
-
218
-
219
-
220
-
221
-
222
-
223
-
224
-
225
-
226
-
227
-
228
-
229
-
230
-
231
-
232
-
233
-
234
-
235
-
236
-
237
-
238
-
239
-
240
-
241
-
242
-
243
-
244
-
245
-
246
-
247
-
248
-
249
-
250
-
251
-
252
-
253
-
254
-
255
-
256
-
257
-
258
-
259
-
260
-
261
-
262
-
263
-
264
-
265
-
266
-
267
-
268
-
269
-
270
-
271
-
272
-
273
-
274
-
275
-
276
-
277
-
278
-
279
-
280
-
281
-
282
-
283
-
284
-
285
-
286
-
287
-
288
-
289
-
290
-
291
-
292
-
293
-
294
-
295
-
296
-
297
-
298
-
299
-
300
-
301
-
302
-
303
-
304
-
305
-
306
-
307
 |
 |
Performance Monitoring
160
Web Tools Version 3.1.x/4.1.x User Guide
Print All Graphs
Use the Print All Graphs option in the Actions menu to print all the graphs
displayed on the selected canvas configuration. Only one canvas configuration can
be opened at a time. Each Canvas Configuration can have a total of 8 monitors.
Table 38:
Display Resource Usage
Field
Description
Port
This column displays all the ports available for monitoring in
the switch.
EE 0-7
Displays the number of End-to-End Monitors configured for a
particular port. Each port can have a maximum of 8
monitors.
FL24-31
Displays the number of Filter Monitors configured for a
particular port. Each port can have a maximum of 8
monitors.