HP StorageWorks 16-EL HP StorageWorks Web Tools V3.1.x/4.1.x User Guide (AA-RS - Page 165
Basic Monitoring Descriptions, Table 39: Basic Monitoring Graph Descriptions
 |
View all HP StorageWorks 16-EL manuals
Add to My Manuals
Save this manual to your list of manuals |
Page 165 highlights
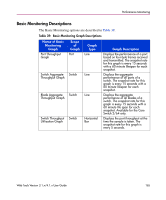
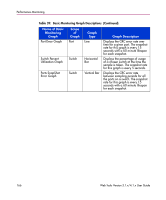
Performance Monitoring Basic Monitoring Descriptions The Basic Monitoring options are described in Table 39. Table 39: Basic Monitoring Graph Descriptions Name of Basic Monitoring Graph Port Throughput Graph Scope of Graph Port Graph Type Line Switch Aggregate Switch Line Throughput Graph Blade Aggregate Switch Line Throughput Graph Switch Throughput Switch Utilization Graph Horizontal Bar Graph Description Displays the performance of a port based on four-byte frames received and transmitted. The snapshot rate for this graph is every 15 seconds with a 60 minute lifespan for each snapshot. Displays the aggregate performance of all ports of a switch. The snapshot rate for this graph is every 15 seconds with a 60 minute lifespan for each snapshot. Displays the aggregate performance of all blades of a switch. The snapshot rate for this graph is every 15 seconds with a 60 minute life span for each snapshot. Available for the Core Switch 2/64 only. Displays the port throughput at the time the sample is taken. The snapshot rate for this graph is every 5 seconds. Web Tools Version 3.1.x/4.1.x User Guide 165
-
 1
1 -
2
-
3
-
4
-
5
-
6
-
7
-
8
-
9
-
10
-
11
-
12
-
13
-
14
-
15
-
16
-
17
-
18
-
19
-
20
-
21
-
22
-
23
-
24
-
25
-
26
-
27
-
28
-
29
-
30
-
31
-
32
-
33
-
34
-
35
-
36
-
37
-
38
-
39
-
40
-
41
-
42
-
43
-
44
-
45
-
46
-
47
-
48
-
49
-
50
-
51
-
52
-
53
-
54
-
55
-
56
-
57
-
58
-
59
-
60
-
61
-
62
-
63
-
64
-
65
-
66
-
67
-
68
-
69
-
70
-
71
-
72
-
73
-
74
-
75
-
76
-
77
-
78
-
79
-
80
-
81
-
82
-
83
-
84
-
85
-
86
-
87
-
88
-
89
-
90
-
91
-
92
-
93
-
94
-
95
-
96
-
97
-
98
-
99
-
100
-
101
-
102
-
103
-
104
-
105
-
106
-
107
-
108
-
109
-
110
-
111
-
112
-
113
-
114
-
115
-
116
-
117
-
118
-
119
-
120
-
121
-
122
-
123
-
124
-
125
-
126
-
127
-
128
-
129
-
130
-
131
-
132
-
133
-
134
-
135
-
136
-
137
-
138
-
139
-
140
-
141
-
142
-
143
-
144
-
145
-
146
-
147
-
148
-
149
-
150
-
151
-
152
-
153
-
154
-
155
-
156
-
157
-
158
-
159
-
 160
160 -
 161
161 -
 162
162 -
 163
163 -
 164
164 -
 165
165 -
 166
166 -
 167
167 -
 168
168 -
 169
169 -
 170
170 -
171
-
172
-
173
-
174
-
175
-
176
-
177
-
178
-
179
-
180
-
181
-
182
-
183
-
184
-
185
-
186
-
187
-
188
-
189
-
190
-
191
-
192
-
193
-
194
-
195
-
196
-
197
-
198
-
199
-
200
-
201
-
202
-
203
-
204
-
205
-
206
-
207
-
208
-
209
-
210
-
211
-
212
-
213
-
214
-
215
-
216
-
217
-
218
-
219
-
220
-
221
-
222
-
223
-
224
-
225
-
226
-
227
-
228
-
229
-
230
-
231
-
232
-
233
-
234
-
235
-
236
-
237
-
238
-
239
-
240
-
241
-
242
-
243
-
244
-
245
-
246
-
247
-
248
-
249
-
250
-
251
-
252
-
253
-
254
-
255
-
256
-
257
-
258
-
259
-
260
-
261
-
262
-
263
-
264
-
265
-
266
-
267
-
268
-
269
-
270
-
271
-
272
-
273
-
274
-
275
-
276
-
277
-
278
-
279
-
280
-
281
-
282
-
283
-
284
-
285
-
286
-
287
-
288
-
289
-
290
-
291
-
292
-
293
-
294
-
295
-
296
-
297
-
298
-
299
-
300
-
301
-
302
-
303
-
304
-
305
-
306
-
307
 |
 |