HP StorageWorks 16-EL HP StorageWorks Web Tools V3.1.x/4.1.x User Guide (AA-RS - Page 54
Switch Graphic Buttons, Table 7: Switch Panel Buttons
 |
View all HP StorageWorks 16-EL manuals
Add to My Manuals
Save this manual to your list of manuals |
Page 54 highlights
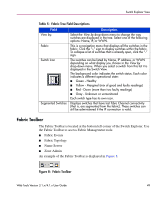
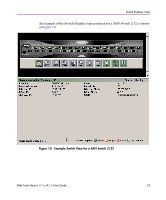
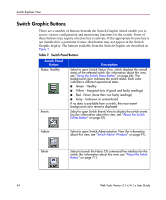
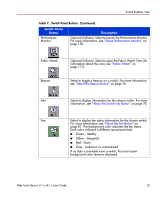
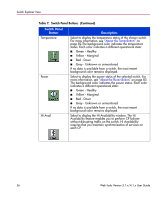
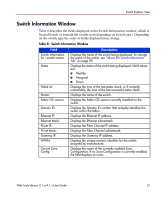
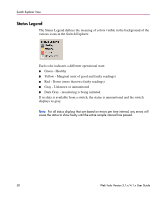
Switch Explorer View Switch Graphic Buttons There are a number of buttons beneath the Switch Graphic which enable you to access various configuration and monitoring functions for the switch. Some of these buttons may require a license key to activate. If the appropriate license key is not installed for a particular feature, that button may not appear in the Switch Graphic display. The buttons available from the Switch Graphic are described in Table 7. Table 7: Switch Panel Buttons Switch Panel Button Status: Healthy Events Description Select to open Switch Status View, which displays the overall status of the selected switch (for information about this view, see "Using the Switch Status Button" on page 66). The background color indicates the switch status. Each color indicates a different operational state: ■ Green - Healthy ■ Yellow - Marginal (mix of good and faulty readings) ■ Red - Down (more than two faulty readings) ■ Gray - Unknown or unmonitored If no data is available from a switch, the most recent background color remains displayed. Select to open Switch Events View to display the switch events log (for information about this view, see "About the Switch Events Button" on page 67). Admin Select to open Switch Administration View (for information about this view, see "Switch Admin Window" on page 91). Telnet Select to launch the Fabric OS command line interface for the switch (for information about this view, see "About the Telnet Button" on page 71). 54 Web Tools Version 3.1.x/4.1.x User Guide
-
 1
1 -
2
-
3
-
4
-
5
-
6
-
7
-
8
-
9
-
10
-
11
-
12
-
13
-
14
-
15
-
16
-
17
-
18
-
19
-
20
-
21
-
22
-
23
-
24
-
25
-
26
-
27
-
28
-
29
-
30
-
31
-
32
-
33
-
34
-
35
-
36
-
37
-
38
-
39
-
40
-
41
-
42
-
43
-
44
-
45
-
46
-
47
-
48
-
 49
49 -
 50
50 -
 51
51 -
 52
52 -
 53
53 -
 54
54 -
 55
55 -
 56
56 -
 57
57 -
 58
58 -
 59
59 -
60
-
61
-
62
-
63
-
64
-
65
-
66
-
67
-
68
-
69
-
70
-
71
-
72
-
73
-
74
-
75
-
76
-
77
-
78
-
79
-
80
-
81
-
82
-
83
-
84
-
85
-
86
-
87
-
88
-
89
-
90
-
91
-
92
-
93
-
94
-
95
-
96
-
97
-
98
-
99
-
100
-
101
-
102
-
103
-
104
-
105
-
106
-
107
-
108
-
109
-
110
-
111
-
112
-
113
-
114
-
115
-
116
-
117
-
118
-
119
-
120
-
121
-
122
-
123
-
124
-
125
-
126
-
127
-
128
-
129
-
130
-
131
-
132
-
133
-
134
-
135
-
136
-
137
-
138
-
139
-
140
-
141
-
142
-
143
-
144
-
145
-
146
-
147
-
148
-
149
-
150
-
151
-
152
-
153
-
154
-
155
-
156
-
157
-
158
-
159
-
160
-
161
-
162
-
163
-
164
-
165
-
166
-
167
-
168
-
169
-
170
-
171
-
172
-
173
-
174
-
175
-
176
-
177
-
178
-
179
-
180
-
181
-
182
-
183
-
184
-
185
-
186
-
187
-
188
-
189
-
190
-
191
-
192
-
193
-
194
-
195
-
196
-
197
-
198
-
199
-
200
-
201
-
202
-
203
-
204
-
205
-
206
-
207
-
208
-
209
-
210
-
211
-
212
-
213
-
214
-
215
-
216
-
217
-
218
-
219
-
220
-
221
-
222
-
223
-
224
-
225
-
226
-
227
-
228
-
229
-
230
-
231
-
232
-
233
-
234
-
235
-
236
-
237
-
238
-
239
-
240
-
241
-
242
-
243
-
244
-
245
-
246
-
247
-
248
-
249
-
250
-
251
-
252
-
253
-
254
-
255
-
256
-
257
-
258
-
259
-
260
-
261
-
262
-
263
-
264
-
265
-
266
-
267
-
268
-
269
-
270
-
271
-
272
-
273
-
274
-
275
-
276
-
277
-
278
-
279
-
280
-
281
-
282
-
283
-
284
-
285
-
286
-
287
-
288
-
289
-
290
-
291
-
292
-
293
-
294
-
295
-
296
-
297
-
298
-
299
-
300
-
301
-
302
-
303
-
304
-
305
-
306
-
307
 |
 |
