Dell PowerConnect FCS624S Web Management Interface User Guide - Page 54
Monitor > RMON > History, Monitoring the RMON Ethernet history
 |
View all Dell PowerConnect FCS624S manuals
Add to My Manuals
Save this manual to your list of manuals |
Page 54 highlights
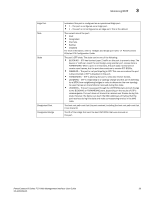
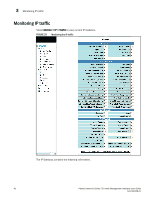
3 Monitoring RMON (Remote Monitoring) history Select Monitor > RMON > History to view RMON history data details. FIGURE 30 Monitoring the RMON Ethernet history The RMON History table contains the following information. Port Time Stamp Utilization Drop Events Octets Packets Slot number or Port number for which the history data is being presented. Day and time when the data was collected. Percentage of the port that was being utilized when the data was taken. Indicates an overrun at the port. The port logic could not receive the traffic at full line rate and had to drop some packets as a result. The counter indicates the total number of events in which packets were dropped by the RMON probe due to lack of resources. This number is not necessarily the number of packets dropped, but is the number of times an overrun condition has been detected. The total number of octets of data received on the network. This number includes octets in bad packets. This number does not include framing bits but does include Frame Check Sequence (FCS) octets. The total number of packets received. This number includes bad packets, broadcast packets, and multicast packets. 44 PowerConnect B-Series FCX Web Management Interface User Guide 53-1002268-01
-
 1
1 -
2
-
3
-
4
-
5
-
6
-
7
-
8
-
9
-
10
-
11
-
12
-
13
-
14
-
15
-
16
-
17
-
18
-
19
-
20
-
21
-
22
-
23
-
24
-
25
-
26
-
27
-
28
-
29
-
30
-
31
-
32
-
33
-
34
-
35
-
36
-
37
-
38
-
39
-
40
-
41
-
42
-
43
-
44
-
45
-
46
-
47
-
48
-
 49
49 -
 50
50 -
 51
51 -
 52
52 -
 53
53 -
 54
54 -
 55
55 -
 56
56 -
 57
57 -
 58
58 -
 59
59 -
60
-
61
-
62
-
63
-
64
-
65
-
66
-
67
-
68
-
69
-
70
-
71
-
72
-
73
-
74
-
75
-
76
-
77
-
78
-
79
-
80
-
81
-
82
-
83
-
84
-
85
-
86
-
87
-
88
-
89
-
90
-
91
-
92
-
93
-
94
-
95
-
96
-
97
-
98
-
99
-
100
-
101
-
102
-
103
-
104
-
105
-
106
-
107
-
108
-
109
-
110
-
111
-
112
-
113
-
114
-
115
-
116
-
117
-
118
-
119
-
120
-
121
-
122
-
123
-
124
-
125
-
126
-
127
-
128
-
129
-
130
-
131
-
132
-
133
-
134
-
135
-
136
-
137
-
138
-
139
-
140
-
141
-
142
-
143
-
144
-
145
-
146
-
147
-
148
-
149
-
150
-
151
-
152
 |
 |
