Dell PowerEdge M610x Fabric OS Command Reference Manual Supporting Fabric - Page 102
is displayed in addition to individual port statistics. The union value provides a good indicator
 |
View all Dell PowerEdge M610x manuals
Add to My Manuals
Save this manual to your list of manuals |
Page 102 highlights
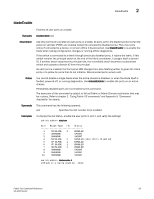
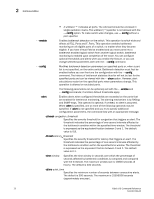
2 bottleneckMon occur because of an underperforming device connected to the F_Port, or because of back pressure from other congestion or latency bottlenecks on the E_Ports. Bottleneck monitoring can help identify these devices and pinpoint the upstream bottlenecks caused by these devices inside the fabric. When bottleneck monitoring is enabled on a switch and -alert is specified, the command triggers an SNMP and a RASlog alert when the ports on the configured switch experience latency or congestion. Another alert is sent after the condition resolves. For a given averaging time, each second is marked as affected by latency and/or congestion or not. If the number of affected seconds crosses the configured threshold, an alert is triggered for the port. You can configure a severity threshold for each type of bottleneck and the time interval over which the bottlenecks are measured. For example, setting a latency threshold of 0.8 and a time window of 30 seconds specifies that an alert should be sent when 80% of the one-second samples over any period of 30 seconds were affected by latency bottleneck conditions. The -qtime option can be used to throttle alerts by specifying the minimum number of seconds between consecutive alerts. Thresholds are configured separately for each type of bottleneck and statistical data are collected independently for each condition. The -qtime parameter applies to both types of bottleneck monitoring; there can be one latency alert and one congestion alert in a configured quiet time. Bottleneck monitoring works both in non-Virtual Fabric mode and in Virtual Fabric Mode. If Virtual Fabrics are enabled, bottleneck monitoring is configured per logical switch. If a port is removed from a logical switch after bottleneck detection is enabled on the logical switch, the configuration is retained in that logical switch. If the port is added again to the same logical switch, bottleneck detection is automatically re-enabled for this port using the retained configuration. This feature allows you to configure more than one logical switch to perform bottleneck detection on the same port, although only one logical switch performs the operation on the port at any given time. The --show option displays a history of the bottleneck severity for a specified port or for all ports. Each line of output shows the percentage of one-second intervals affected by bottleneck conditions during the time window shown on that line. When issued for all ports, the union of all port statistics is displayed in addition to individual port statistics. The union value provides a good indicator for the overall bottleneck severity on the switch. You can filter the output to display only latency or congestion bottleneck statistics. When used without port operand the command displays the number of ports affected by bottleneck conditions. A "bottlenecked" port in this output is defined as any port that was affected by a bottleneck for one second or more in the corresponding interval. The --status option displays bottleneck configuration details for the current (logical) switch. If virtual fabrics are enabled, ports not belonging to the current logical switch are not displayed. This is change from v6.3.0, where the output of --status included ports that did not belong to the current logical switch. The command output includes the following information: Bottleneck detection Enabled or disabled Switch-wide alerting parameters Alerts? Yes (enabled) or No (disabled) Congestion threshold for alert The severity threshold for triggering a congestion alert. This threshold indicates the percentage of one-second intervals affected by congestion conditions within a specified time window. The congestion threshold is expressed as a fraction between 0 and 1. 70 Fabric OS Command Reference 53-1001764-02
-
 1
1 -
2
-
3
-
4
-
5
-
6
-
7
-
8
-
9
-
10
-
11
-
12
-
13
-
14
-
15
-
16
-
17
-
18
-
19
-
20
-
21
-
22
-
23
-
24
-
25
-
26
-
27
-
28
-
29
-
30
-
31
-
32
-
33
-
34
-
35
-
36
-
37
-
38
-
39
-
40
-
41
-
42
-
43
-
44
-
45
-
46
-
47
-
48
-
49
-
50
-
51
-
52
-
53
-
54
-
55
-
56
-
57
-
58
-
59
-
60
-
61
-
62
-
63
-
64
-
65
-
66
-
67
-
68
-
69
-
70
-
71
-
72
-
73
-
74
-
75
-
76
-
77
-
78
-
79
-
80
-
81
-
82
-
83
-
84
-
85
-
86
-
87
-
88
-
89
-
90
-
91
-
92
-
93
-
94
-
95
-
96
-
 97
97 -
 98
98 -
 99
99 -
 100
100 -
 101
101 -
 102
102 -
 103
103 -
 104
104 -
 105
105 -
 106
106 -
 107
107 -
108
-
109
-
110
-
111
-
112
-
113
-
114
-
115
-
116
-
117
-
118
-
119
-
120
-
121
-
122
-
123
-
124
-
125
-
126
-
127
-
128
-
129
-
130
-
131
-
132
-
133
-
134
-
135
-
136
-
137
-
138
-
139
-
140
-
141
-
142
-
143
-
144
-
145
-
146
-
147
-
148
-
149
-
150
-
151
-
152
-
153
-
154
-
155
-
156
-
157
-
158
-
159
-
160
-
161
-
162
-
163
-
164
-
165
-
166
-
167
-
168
-
169
-
170
-
171
-
172
-
173
-
174
-
175
-
176
-
177
-
178
-
179
-
180
-
181
-
182
-
183
-
184
-
185
-
186
-
187
-
188
-
189
-
190
-
191
-
192
-
193
-
194
-
195
-
196
-
197
-
198
-
199
-
200
-
201
-
202
-
203
-
204
-
205
-
206
-
207
-
208
-
209
-
210
-
211
-
212
-
213
-
214
-
215
-
216
-
217
-
218
-
219
-
220
-
221
-
222
-
223
-
224
-
225
-
226
-
227
-
228
-
229
-
230
-
231
-
232
-
233
-
234
-
235
-
236
-
237
-
238
-
239
-
240
-
241
-
242
-
243
-
244
-
245
-
246
-
247
-
248
-
249
-
250
-
251
-
252
-
253
-
254
-
255
-
256
-
257
-
258
-
259
-
260
-
261
-
262
-
263
-
264
-
265
-
266
-
267
-
268
-
269
-
270
-
271
-
272
-
273
-
274
-
275
-
276
-
277
-
278
-
279
-
280
-
281
-
282
-
283
-
284
-
285
-
286
-
287
-
288
-
289
-
290
-
291
-
292
-
293
-
294
-
295
-
296
-
297
-
298
-
299
-
300
-
301
-
302
-
303
-
304
-
305
-
306
-
307
-
308
-
309
-
310
-
311
-
312
-
313
-
314
-
315
-
316
-
317
-
318
-
319
-
320
-
321
-
322
-
323
-
324
-
325
-
326
-
327
-
328
-
329
-
330
-
331
-
332
-
333
-
334
-
335
-
336
-
337
-
338
-
339
-
340
-
341
-
342
-
343
-
344
-
345
-
346
-
347
-
348
-
349
-
350
-
351
-
352
-
353
-
354
-
355
-
356
-
357
-
358
-
359
-
360
-
361
-
362
-
363
-
364
-
365
-
366
-
367
-
368
-
369
-
370
-
371
-
372
-
373
-
374
-
375
-
376
-
377
-
378
-
379
-
380
-
381
-
382
-
383
-
384
-
385
-
386
-
387
-
388
-
389
-
390
-
391
-
392
-
393
-
394
-
395
-
396
-
397
-
398
-
399
-
400
-
401
-
402
-
403
-
404
-
405
-
406
-
407
-
408
-
409
-
410
-
411
-
412
-
413
-
414
-
415
-
416
-
417
-
418
-
419
-
420
-
421
-
422
-
423
-
424
-
425
-
426
-
427
-
428
-
429
-
430
-
431
-
432
-
433
-
434
-
435
-
436
-
437
-
438
-
439
-
440
-
441
-
442
-
443
-
444
-
445
-
446
-
447
-
448
-
449
-
450
-
451
-
452
-
453
-
454
-
455
-
456
-
457
-
458
-
459
-
460
-
461
-
462
-
463
-
464
-
465
-
466
-
467
-
468
-
469
-
470
-
471
-
472
-
473
-
474
-
475
-
476
-
477
-
478
-
479
-
480
-
481
-
482
-
483
-
484
-
485
-
486
-
487
-
488
-
489
-
490
-
491
-
492
-
493
-
494
-
495
-
496
-
497
-
498
-
499
-
500
-
501
-
502
-
503
-
504
-
505
-
506
-
507
-
508
-
509
-
510
-
511
-
512
-
513
-
514
-
515
-
516
-
517
-
518
-
519
-
520
-
521
-
522
-
523
-
524
-
525
-
526
-
527
-
528
-
529
-
530
-
531
-
532
-
533
-
534
-
535
-
536
-
537
-
538
-
539
-
540
-
541
-
542
-
543
-
544
-
545
-
546
-
547
-
548
-
549
-
550
-
551
-
552
-
553
-
554
-
555
-
556
-
557
-
558
-
559
-
560
-
561
-
562
-
563
-
564
-
565
-
566
-
567
-
568
-
569
-
570
-
571
-
572
-
573
-
574
-
575
-
576
-
577
-
578
-
579
-
580
-
581
-
582
-
583
-
584
-
585
-
586
-
587
-
588
-
589
-
590
-
591
-
592
-
593
-
594
-
595
-
596
-
597
-
598
-
599
-
600
-
601
-
602
-
603
-
604
-
605
-
606
-
607
-
608
-
609
-
610
-
611
-
612
-
613
-
614
-
615
-
616
-
617
-
618
-
619
-
620
-
621
-
622
-
623
-
624
-
625
-
626
-
627
-
628
-
629
-
630
-
631
-
632
-
633
-
634
-
635
-
636
-
637
-
638
-
639
-
640
-
641
-
642
-
643
-
644
-
645
-
646
-
647
-
648
-
649
-
650
-
651
-
652
-
653
-
654
-
655
-
656
-
657
-
658
-
659
-
660
-
661
-
662
-
663
-
664
-
665
-
666
-
667
-
668
-
669
-
670
-
671
-
672
-
673
-
674
-
675
-
676
-
677
-
678
-
679
-
680
-
681
-
682
-
683
-
684
-
685
-
686
-
687
-
688
-
689
-
690
-
691
-
692
-
693
-
694
-
695
-
696
-
697
-
698
-
699
-
700
-
701
-
702
-
703
-
704
-
705
-
706
-
707
-
708
-
709
-
710
-
711
-
712
-
713
-
714
-
715
-
716
-
717
-
718
-
719
-
720
-
721
-
722
-
723
-
724
-
725
-
726
-
727
-
728
-
729
-
730
-
731
-
732
-
733
-
734
-
735
-
736
-
737
-
738
-
739
-
740
-
741
-
742
-
743
-
744
-
745
-
746
-
747
-
748
-
749
-
750
-
751
-
752
-
753
-
754
-
755
-
756
-
757
-
758
-
759
-
760
-
761
-
762
-
763
-
764
-
765
-
766
-
767
-
768
-
769
-
770
-
771
-
772
-
773
-
774
-
775
-
776
-
777
-
778
-
779
-
780
-
781
-
782
-
783
-
784
-
785
-
786
-
787
-
788
-
789
-
790
-
791
-
792
-
793
-
794
-
795
-
796
-
797
-
798
-
799
-
800
-
801
-
802
-
803
-
804
-
805
-
806
-
807
-
808
-
809
-
810
-
811
-
812
-
813
-
814
-
815
-
816
-
817
-
818
-
819
-
820
-
821
-
822
-
823
-
824
-
825
-
826
-
827
-
828
-
829
-
830
-
831
-
832
-
833
-
834
-
835
-
836
-
837
-
838
-
839
-
840
-
841
-
842
-
843
-
844
-
845
-
846
-
847
-
848
-
849
-
850
-
851
-
852
-
853
-
854
-
855
-
856
-
857
-
858
-
859
-
860
-
861
-
862
-
863
-
864
-
865
-
866
-
867
-
868
-
869
-
870
-
871
-
872
-
873
-
874
-
875
-
876
-
877
-
878
-
879
-
880
-
881
-
882
-
883
-
884
-
885
-
886
-
887
-
888
-
889
-
890
-
891
-
892
-
893
-
894
-
895
-
896
-
897
-
898
-
899
-
900
-
901
-
902
-
903
-
904
-
905
-
906
-
907
-
908
-
909
-
910
-
911
-
912
-
913
-
914
-
915
-
916
-
917
-
918
-
919
-
920
-
921
-
922
-
923
-
924
-
925
-
926
-
927
-
928
-
929
-
930
-
931
-
932
-
933
-
934
-
935
-
936
-
937
-
938
-
939
-
940
-
941
-
942
-
943
-
944
-
945
-
946
-
947
-
948
-
949
-
950
-
951
-
952
-
953
-
954
-
955
-
956
-
957
-
958
-
959
-
960
-
961
-
962
-
963
-
964
-
965
-
966
-
967
-
968
-
969
-
970
-
971
-
972
-
973
-
974
-
975
-
976
-
977
-
978
-
979
-
980
-
981
-
982
-
983
-
984
-
985
-
986
-
987
-
988
-
989
-
990
-
991
-
992
-
993
-
994
-
995
-
996
-
997
-
998
-
999
-
1,000
-
1,001
-
1,002
-
1,003
-
1,004
-
1,005
-
1,006
-
1,007
-
1,008
-
1,009
-
1,010
-
1,011
-
1,012
-
1,013
-
1,014
-
1,015
-
1,016
-
1,017
-
1,018
-
1,019
-
1,020
-
1,021
-
1,022
-
1,023
-
1,024
-
1,025
-
1,026
-
1,027
-
1,028
-
1,029
-
1,030
-
1,031
-
1,032
-
1,033
-
1,034
-
1,035
-
1,036
-
1,037
-
1,038
-
1,039
-
1,040
-
1,041
-
1,042
-
1,043
-
1,044
-
1,045
-
1,046
-
1,047
-
1,048
-
1,049
-
1,050
-
1,051
-
1,052
-
1,053
-
1,054
-
1,055
-
1,056
-
1,057
-
1,058
-
1,059
-
1,060
-
1,061
-
1,062
-
1,063
-
1,064
-
1,065
-
1,066
-
1,067
-
1,068
-
1,069
-
1,070
-
1,071
-
1,072
-
1,073
-
1,074
-
1,075
-
1,076
-
1,077
-
1,078
-
1,079
-
1,080
 |
 |
