McAfee M4050 Troubleshooting Guide - Page 52
Low JVM Memory, Up/Down>
 |
UPC - 731944582832
View all McAfee M4050 manuals
Add to My Manuals
Save this manual to your list of manuals |
Page 52 highlights
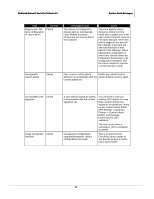
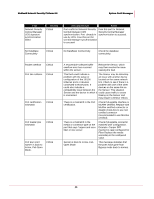
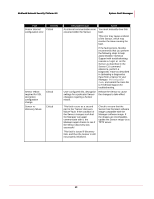
McAfee® Network Security Platform 6.0 System Fault Messages Fault Late Collision of Severity Critical Licence expires soon Critical Licence expired Critical Link failure of Port Critical Low JVM Memory Critical Low Tomcat JVM Critical Memory Description/Cause This fault can indicate a problem with the setup or configuration of the 10/100 Action Check the speed and duplex settings on the sensor ports and the peer device ports and ensure that they are the same. Ethernet ports or devices connected to those ports. It can also indicate a compatibility issue between the Sensor and the device to which it is connected. Indicates that your Network Security Platform license is about to expire; this fault first appears 7 days prior to expiration. Contact [email protected] for a current license. This fault clears when the license is current. Indicates that your Network Security Platform license has expired. Contact [email protected] for a current license. This fault clears when the license is current. The link between a Monitoring Contact your IT department to port on the Sensor and the troubleshoot connectivity device to which it is connected is issues: check the cabling of down, and communication is the specified Monitoring port unavailable. The fault indicates and the device connected to it; which port is affected. check the speed and duplex mode of the connection to the switch or router to ensure parameters such as port speed and duplex mode are set correctly; check power to the switch or router. This fault clears when communication is reestablished. The Manager is experiencing high memory usage. Available system memory is low. Reboot the Manager server. The Manager is experiencing high memory usage. Available system memory is low. Reboot the Manager server. 43
-
 1
1 -
2
-
3
-
4
-
5
-
6
-
7
-
8
-
9
-
10
-
11
-
12
-
13
-
14
-
15
-
16
-
17
-
18
-
19
-
20
-
21
-
22
-
23
-
24
-
25
-
26
-
27
-
28
-
29
-
30
-
31
-
32
-
33
-
34
-
35
-
36
-
37
-
38
-
39
-
40
-
41
-
42
-
43
-
44
-
45
-
46
-
 47
47 -
 48
48 -
 49
49 -
 50
50 -
 51
51 -
 52
52 -
 53
53 -
 54
54 -
 55
55 -
 56
56 -
 57
57 -
58
-
59
-
60
-
61
-
62
-
63
-
64
-
65
-
66
-
67
-
68
-
69
-
70
-
71
-
72
-
73
-
74
-
75
-
76
-
77
-
78
-
79
-
80
-
81
-
82
-
83
-
84
-
85
-
86
-
87
-
88
-
89
-
90
-
91
-
92
-
93
-
94
-
95
 |
 |
