HP XM600 hp toptools 5.5 device manager, user's guide - Page 58
Performance Button, System Performance, Standard Report, Custom Reports, Starting Performance
 |
View all HP XM600 manuals
Add to My Manuals
Save this manual to your list of manuals |
Page 58 highlights
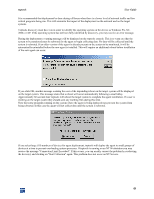
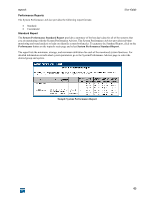
toptools User Guide Note that for the first 15 minutes after collection is started, the message "Data Unavailable" will be displayed in the Condition column. Performance Button Clicking on the Performance button on the toptools control panel will display the following functions: • System Performance • System Performance Standard Report • System Performance Custom Reports If the Hubs and Switches component has been installed, the additional features Traffic Monitor, Network Performance Advisor, and Traffic Data Collector Settings will also be available. Refer to the Hubs and Switches documentation and the descriptions later in this manual for a description of these features. System Performance Selecting System Performance will display the Performance Advisor page. This is the main page for setting up performance monitoring. From here you can: • select the groups of devices to display (Custom Groups to Display) • display summary information for devices in a group (tabs) • start and stop data collection or uninstall the agent (Actions =>Collection) • view detailed performance information for a selected device (Actions => View Analysis) After you have created a custom group of devices you can change the default performance monitor settings (Settings button, System Performance). Once you have begun monitoring devices and have collected performance data you can create performance reports. Standard Report The Standard Report function generates a summary performance report listing key performance parameters values for all of the systems in the selected group. Custom Reports The Custom Reports function helps you create custom performance reports. You can select the systems, parameters, and time periods to report. Once you have created a custom report, you can name and save it for reuse. Starting Performance Monitoring To use the System Performance Advisor you must: • Create a custom group of devices • Deploy performance agents to the devices Performance monitoring functions are used with custom groups of devices. To start monitoring you must create a custom group and then turn on monitoring for the group. If a performance agent is not already present on the systems to be monitored you must deploy or install a performance monitoring agent. On Windows NT, Windows 2000, and XP systems, toptools will automatically deploy an agent when collection is turned on. You must manually install the agent on Windows 9x systems. Refer to the online help for detailed instructions for deployment. 58
-
 1
1 -
2
-
3
-
4
-
5
-
6
-
7
-
8
-
9
-
10
-
11
-
12
-
13
-
14
-
15
-
16
-
17
-
18
-
19
-
20
-
21
-
22
-
23
-
24
-
25
-
26
-
27
-
28
-
29
-
30
-
31
-
32
-
33
-
34
-
35
-
36
-
37
-
38
-
39
-
40
-
41
-
42
-
43
-
44
-
45
-
46
-
47
-
48
-
49
-
50
-
51
-
52
-
 53
53 -
 54
54 -
 55
55 -
 56
56 -
 57
57 -
 58
58 -
 59
59 -
 60
60 -
 61
61 -
 62
62 -
 63
63 -
64
-
65
-
66
-
67
-
68
-
69
-
70
-
71
-
72
-
73
-
74
-
75
-
76
-
77
-
78
-
79
-
80
-
81
-
82
-
83
-
84
-
85
-
86
-
87
-
88
-
89
-
90
-
91
-
92
-
93
-
94
-
95
-
96
 |
 |
