HP XM600 hp toptools 5.5 device manager, user's guide - Page 59
Creating A Custom Group, Selecting A Group to Monitor, Configuring the Performance Advisor
 |
View all HP XM600 manuals
Add to My Manuals
Save this manual to your list of manuals |
Page 59 highlights
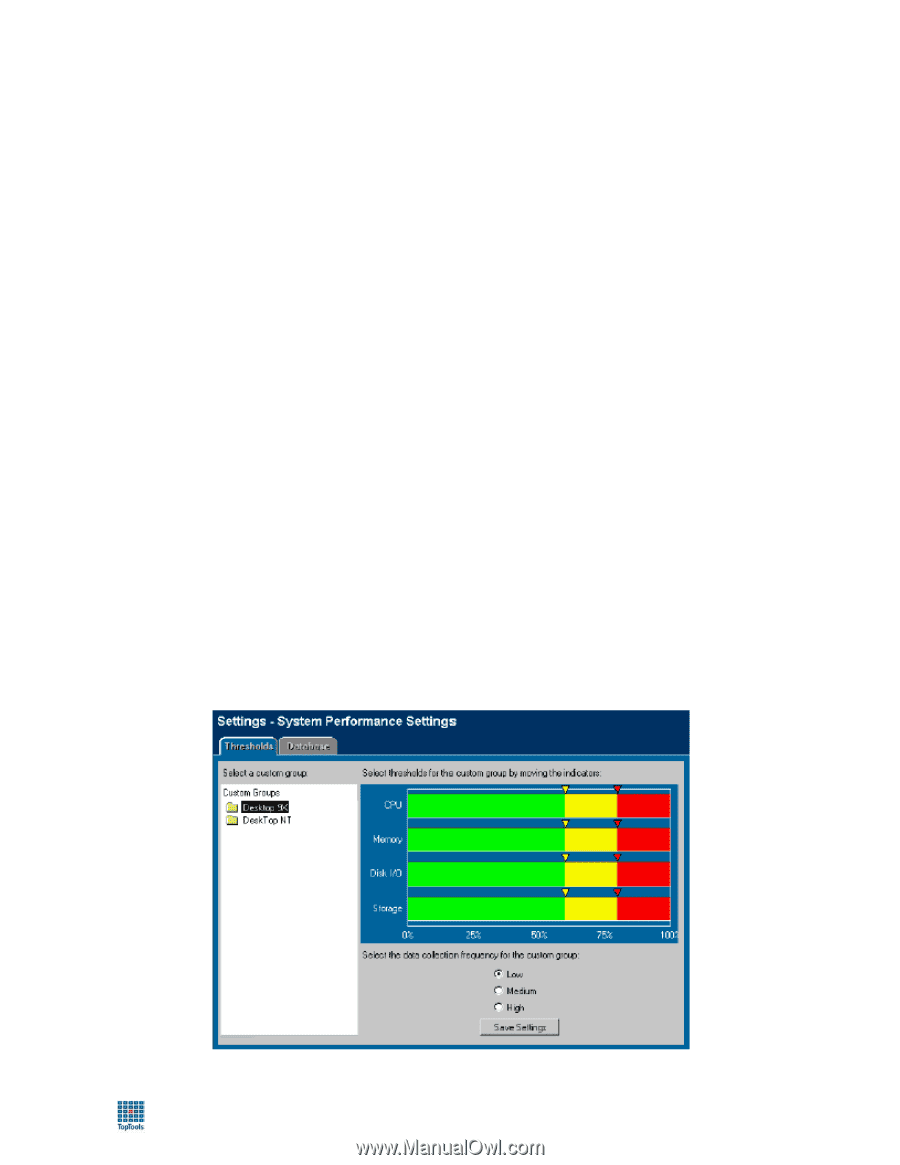
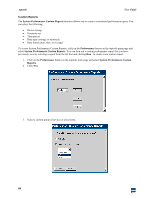
toptools User Guide Creating A Custom Group 1. Create one or more custom groups containing devices to be monitored. On the toptools main page, click on the Devices button and select Custom Groups. This will display the Custom Groups tab of the Devices dialog. 2. Click on Actions and New Group. This will display The New Custom Group dialog. 3. Enter the name for a group to be monitored (example Desktop 9X) and click Create. The new group will be added to the list of custom groups. 4. Click on the Devices tab to display the list of network devices. 5. Select Personal Computers to display available computer systems. 6. Highlight the systems you want to add to the group and click Actions, Add to Custom Group. This will display the Add to Custom Group Dialog. 7. Click on the desired group and click on Add. You can check to see that the systems have been added by clicking on the Custom Groups tab and then clicking on the new group. Selecting A Group to Monitor 1. On the main toptools window, click on the Performance button and select System Performance. This will 2. display the System Performance Advisor page. 3. Click on the Custom Groups to Display button in the upper right of the Performance Advisor page to add custom groups to the performance display. A "pie" chart will be displayed for the group in the upper half of the page. It will initially be gray because data has not yet been collected. The systems in the group will be displayed in the bottom half of the page. Configuring the Performance Advisor You can configure alert thresholds for system resources, frequency of data collection, and select the parameters and time for performance data holding time for each group. The Thresholds tab on the Performance Settings page displays the System Performance Thresholds page. On this page you can set threshold levels for CPU, Memory, Disk I/O, and Storage utilization for the selected group of devices. You can also set the frequency at which performance data will be gathered. Threshold settings affect: • Summary pie charts • Icons in the status column of the list of System Performance Advisor • Alert generation - an alert will be generated each time a system changes status (NORMAL, WARNING, CRITICAL) 59
-
 1
1 -
2
-
3
-
4
-
5
-
6
-
7
-
8
-
9
-
10
-
11
-
12
-
13
-
14
-
15
-
16
-
17
-
18
-
19
-
20
-
21
-
22
-
23
-
24
-
25
-
26
-
27
-
28
-
29
-
30
-
31
-
32
-
33
-
34
-
35
-
36
-
37
-
38
-
39
-
40
-
41
-
42
-
43
-
44
-
45
-
46
-
47
-
48
-
49
-
50
-
51
-
52
-
53
-
 54
54 -
 55
55 -
 56
56 -
 57
57 -
 58
58 -
 59
59 -
 60
60 -
 61
61 -
 62
62 -
 63
63 -
 64
64 -
65
-
66
-
67
-
68
-
69
-
70
-
71
-
72
-
73
-
74
-
75
-
76
-
77
-
78
-
79
-
80
-
81
-
82
-
83
-
84
-
85
-
86
-
87
-
88
-
89
-
90
-
91
-
92
-
93
-
94
-
95
-
96
 |
 |