D-Link DGS-3208TG User Guide - Page 114
Traffic, Total Bytes Received
 |
UPC - 790069239366
View all D-Link DGS-3208TG manuals
Add to My Manuals
Save this manual to your list of manuals |
Page 114 highlights
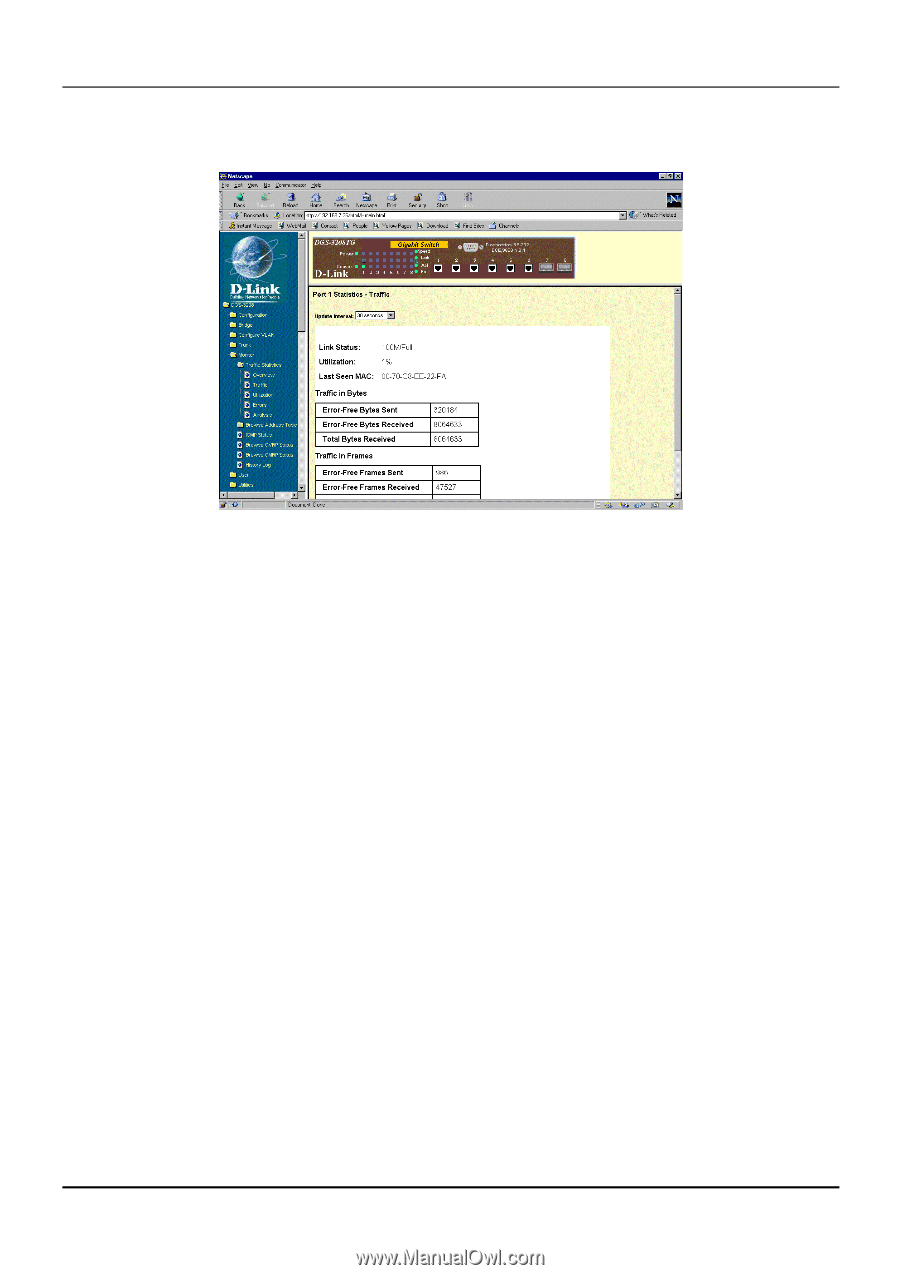
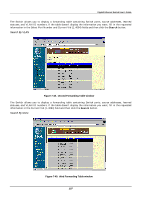
Gigabit Ethernet Switch User's Guide Traffic Figure 7-42. Port Statistics - Traffic window The port statistics shown by default are those for the port you last configured. Once in the Traffic Statistics windows, you can click any port on the switch graphic to show statistics for that port. Click Reset Counter to clear all the counters on the window above. The information is described as follows: ♦ Update Interval Choose the desired setting: 1 second, 5 seconds, 15 seconds, 30 seconds, 60 seconds or Suspend. ♦ Link Status Indicates whether the port is online and working (1000/Full/Flow control off or 1000/Full/Flow control on) or not (Link Down). ♦ Utilization Current utilization for the port, as a percentage of total available bandwidth. ♦ Last Screen MAC The last MAC address learned by the Switch. Traffic in Bytes: ♦ Error-Free Bytes Sent Counts the number of bytes successfully sent from the port. ♦ Error-Free Bytes Received Counts the total number of bytes (octets) included in valid (readable) frames. ♦ Total Bytes Received Counts the total number of bytes received on the port, whether in valid or invalid frames. Traffic in Frames: ♦ Error-Free Frames Sent Counts the total number of frames transmitted from the port. ♦ Error-Free Frames Received Counts all valid frames received on the port. ♦ Total Frames Received Counts the number of frames received on the port, whether they were valid or not. 102
-
 1
1 -
2
-
3
-
4
-
5
-
6
-
7
-
8
-
9
-
10
-
11
-
12
-
13
-
14
-
15
-
16
-
17
-
18
-
19
-
20
-
21
-
22
-
23
-
24
-
25
-
26
-
27
-
28
-
29
-
30
-
31
-
32
-
33
-
34
-
35
-
36
-
37
-
38
-
39
-
40
-
41
-
42
-
43
-
44
-
45
-
46
-
47
-
48
-
49
-
50
-
51
-
52
-
53
-
54
-
55
-
56
-
57
-
58
-
59
-
60
-
61
-
62
-
63
-
64
-
65
-
66
-
67
-
68
-
69
-
70
-
71
-
72
-
73
-
74
-
75
-
76
-
77
-
78
-
79
-
80
-
81
-
82
-
83
-
84
-
85
-
86
-
87
-
88
-
89
-
90
-
91
-
92
-
93
-
94
-
95
-
96
-
97
-
98
-
99
-
100
-
101
-
102
-
103
-
104
-
105
-
106
-
107
-
108
-
 109
109 -
 110
110 -
 111
111 -
 112
112 -
 113
113 -
 114
114 -
 115
115 -
 116
116 -
 117
117 -
 118
118 -
 119
119 -
120
-
121
-
122
-
123
-
124
-
125
-
126
-
127
-
128
-
129
-
130
-
131
-
132
-
133
-
134
-
135
-
136
 |
 |