D-Link DGS-3208TG User Guide - Page 75
Statistics Overview, Traffic Statistics, Polling Interval, TX/sec, Util.
 |
UPC - 790069239366
View all D-Link DGS-3208TG manuals
Add to My Manuals
Save this manual to your list of manuals |
Page 75 highlights
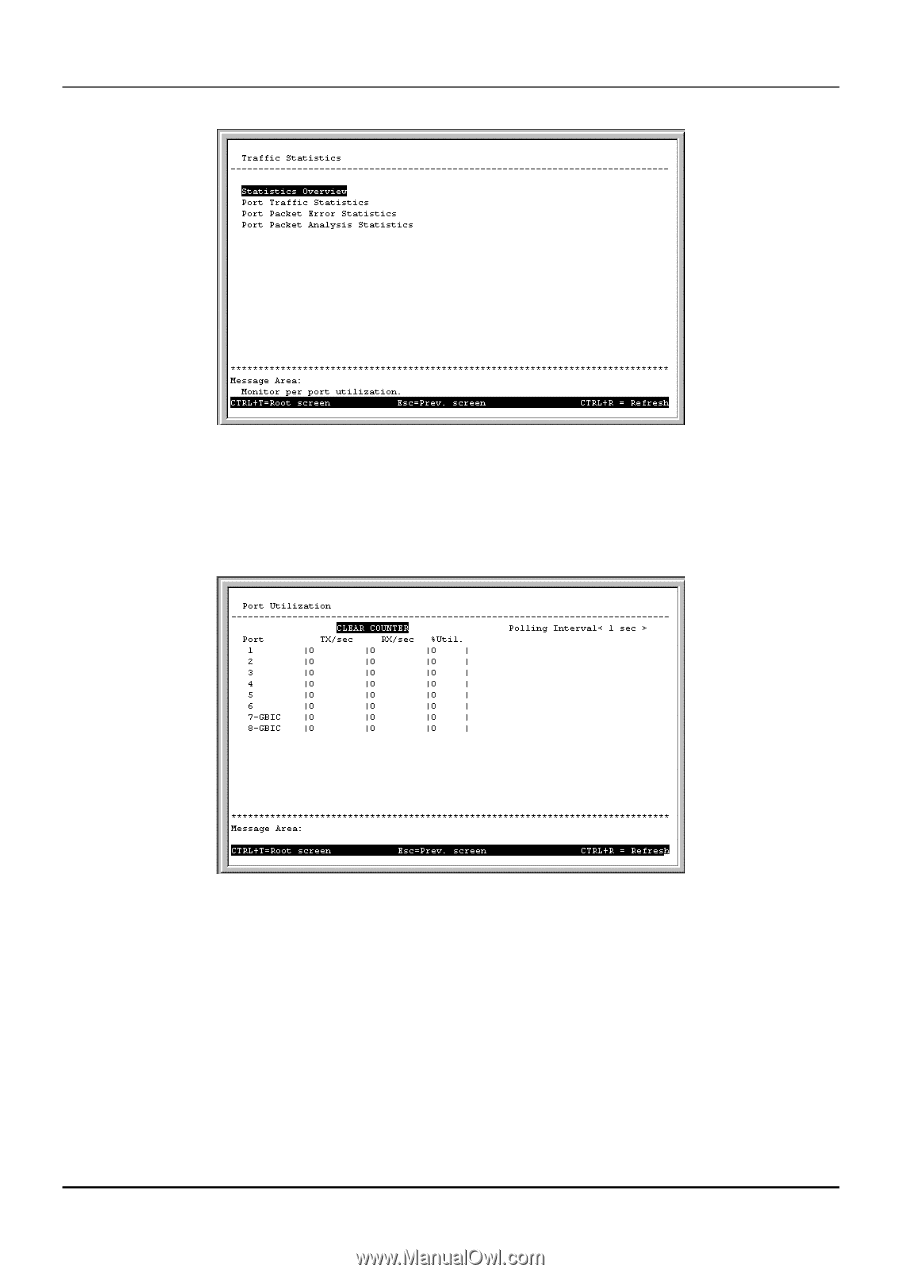
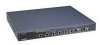
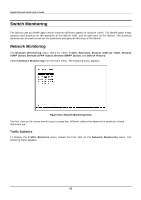
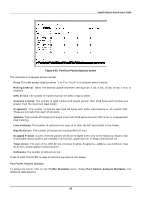
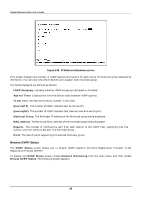
Gigabit Ethernet Switch User's Guide Figure 6-52. Traffic Statistics menu Statistics Overview To access the first item on the Traffic Statistics menu, choose Statistics Overview. The following table appears: Figure 6-53. Port Utilization screen The information displayed above includes: ♦ Polling Interval Select the desired update increment setting from: 1 sec, 5 sec, 15 sec, 30 sec, 1 min, or Suspend. ♦ TX/sec The number of good bytes sent from the respective port per second. ♦ RX/sec The number of good bytes received per second. This also includes local and dropped packets. ♦ %Util. This shows the percentage of available bandwidth each port is using over the amount of time specified by the update interval. Press CLEAR COUNTER to reset all statistic counters on this screen. 63
-
 1
1 -
2
-
3
-
4
-
5
-
6
-
7
-
8
-
9
-
10
-
11
-
12
-
13
-
14
-
15
-
16
-
17
-
18
-
19
-
20
-
21
-
22
-
23
-
24
-
25
-
26
-
27
-
28
-
29
-
30
-
31
-
32
-
33
-
34
-
35
-
36
-
37
-
38
-
39
-
40
-
41
-
42
-
43
-
44
-
45
-
46
-
47
-
48
-
49
-
50
-
51
-
52
-
53
-
54
-
55
-
56
-
57
-
58
-
59
-
60
-
61
-
62
-
63
-
64
-
65
-
66
-
67
-
68
-
69
-
 70
70 -
 71
71 -
 72
72 -
 73
73 -
 74
74 -
 75
75 -
 76
76 -
 77
77 -
 78
78 -
 79
79 -
 80
80 -
81
-
82
-
83
-
84
-
85
-
86
-
87
-
88
-
89
-
90
-
91
-
92
-
93
-
94
-
95
-
96
-
97
-
98
-
99
-
100
-
101
-
102
-
103
-
104
-
105
-
106
-
107
-
108
-
109
-
110
-
111
-
112
-
113
-
114
-
115
-
116
-
117
-
118
-
119
-
120
-
121
-
122
-
123
-
124
-
125
-
126
-
127
-
128
-
129
-
130
-
131
-
132
-
133
-
134
-
135
-
136
 |
 |