Garmin Rino 520HCx Owner's Manual - Page 38
Viewing Pressure/Elevation Plots, Adjusting the Zoom Ranges, To view elevation or pressure plots
 |
UPC - 753759066833
View all Garmin Rino 520HCx manuals
Add to My Manuals
Save this manual to your list of manuals |
Page 38 highlights
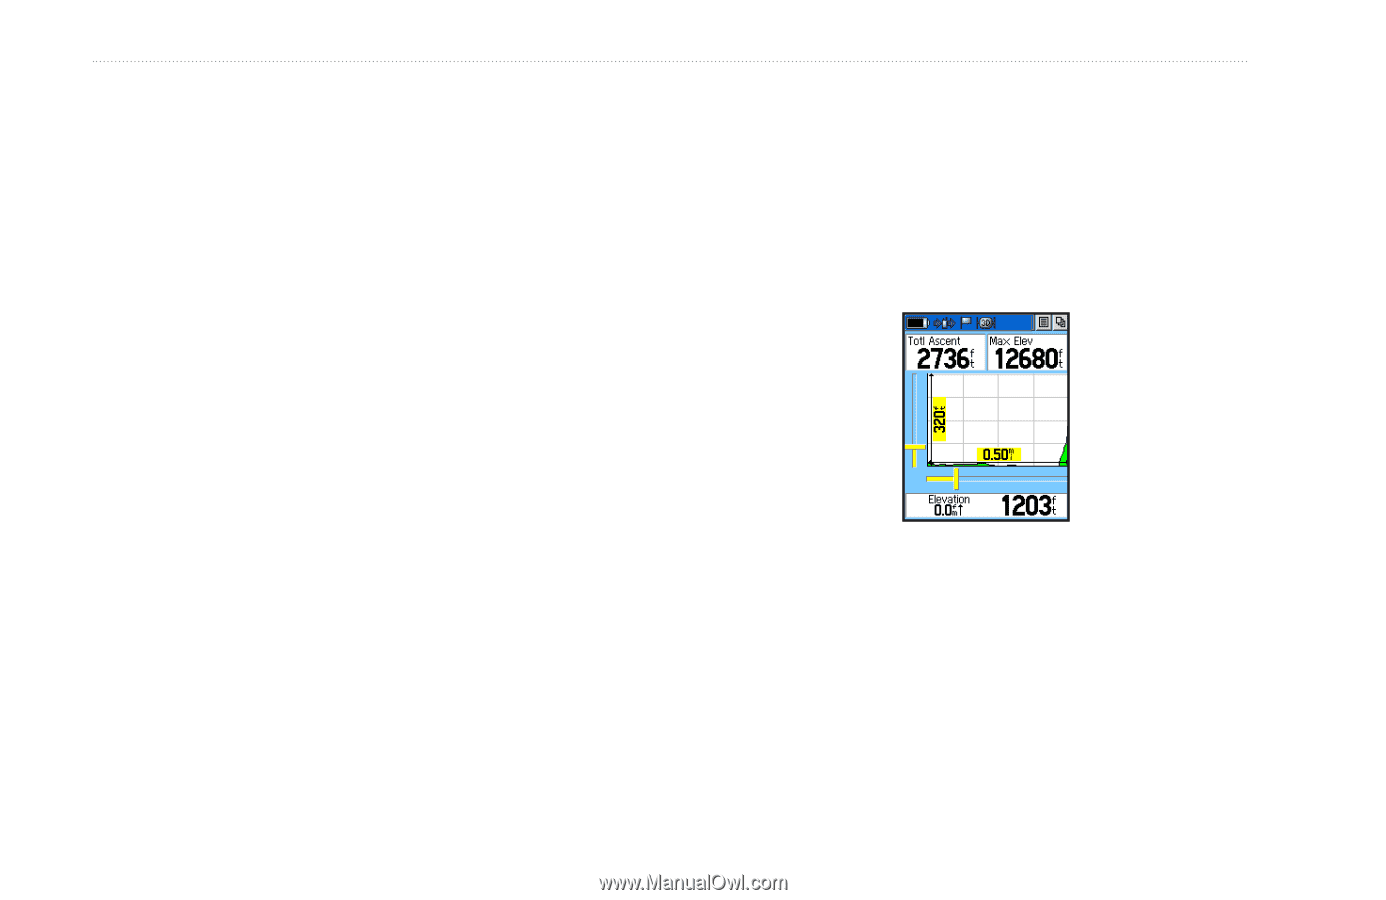
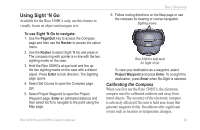
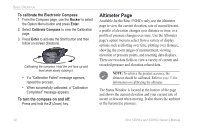
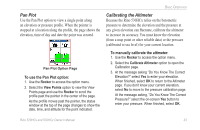
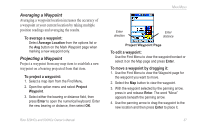
Basic Operation Viewing Pressure/Elevation Plots Select the View Elevation Plot option, to plot a profile of elevation changes that occur as you navigate over a set distance or period of time. Use View Pressure Plot to view a record of changes in the ambient or the barometric pressure for a set period of time. To view elevation or pressure plots: 1. Use the Rocker to select the preferred option from the option menu and then press in to view the plot. 2. Adjust the time and distance measurement using the Elevation Plot Zoom Ranges feature. 3. To clear the plot and start a new one, you must clear the track log. Adjusting the Zoom Ranges Set the zoom ranges for elevation, distance, or time when you use the View Elevation Plot. Change the ranges for the horizontal and vertical scales. To adjust zoom ranges: 1. Select the type of plot you want to show and use the Rocker to select Zoom Ranges from the option menu and press Enter. 2. Move the Rocker up or down to adjust the vertical distance and left or right to adjust either the time or distance. Press Enter to return to the plot. Zoom range selection 32 Rino 520HCx and 530HCx Owner's Manual
-
 1
1 -
2
-
3
-
4
-
5
-
6
-
7
-
8
-
9
-
10
-
11
-
12
-
13
-
14
-
15
-
16
-
17
-
18
-
19
-
20
-
21
-
22
-
23
-
24
-
25
-
26
-
27
-
28
-
29
-
30
-
31
-
32
-
 33
33 -
 34
34 -
 35
35 -
 36
36 -
 37
37 -
 38
38 -
 39
39 -
 40
40 -
 41
41 -
 42
42 -
 43
43 -
44
-
45
-
46
-
47
-
48
-
49
-
50
-
51
-
52
-
53
-
54
-
55
-
56
-
57
-
58
-
59
-
60
-
61
-
62
-
63
-
64
-
65
-
66
-
67
-
68
-
69
-
70
-
71
-
72
-
73
-
74
 |
 |