Netgear FM114P FR114W Reference Manual - Page 97
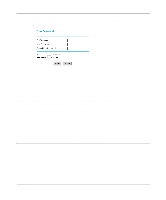
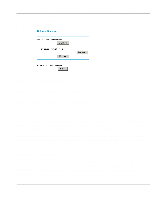
Click on the Show PPPoE Status button to display the progress of the PPPoE connection, - how to reset
 |
UPC - 606449024029
View all Netgear FM114P manuals
Add to My Manuals
Save this manual to your list of manuals |
Page 97 highlights
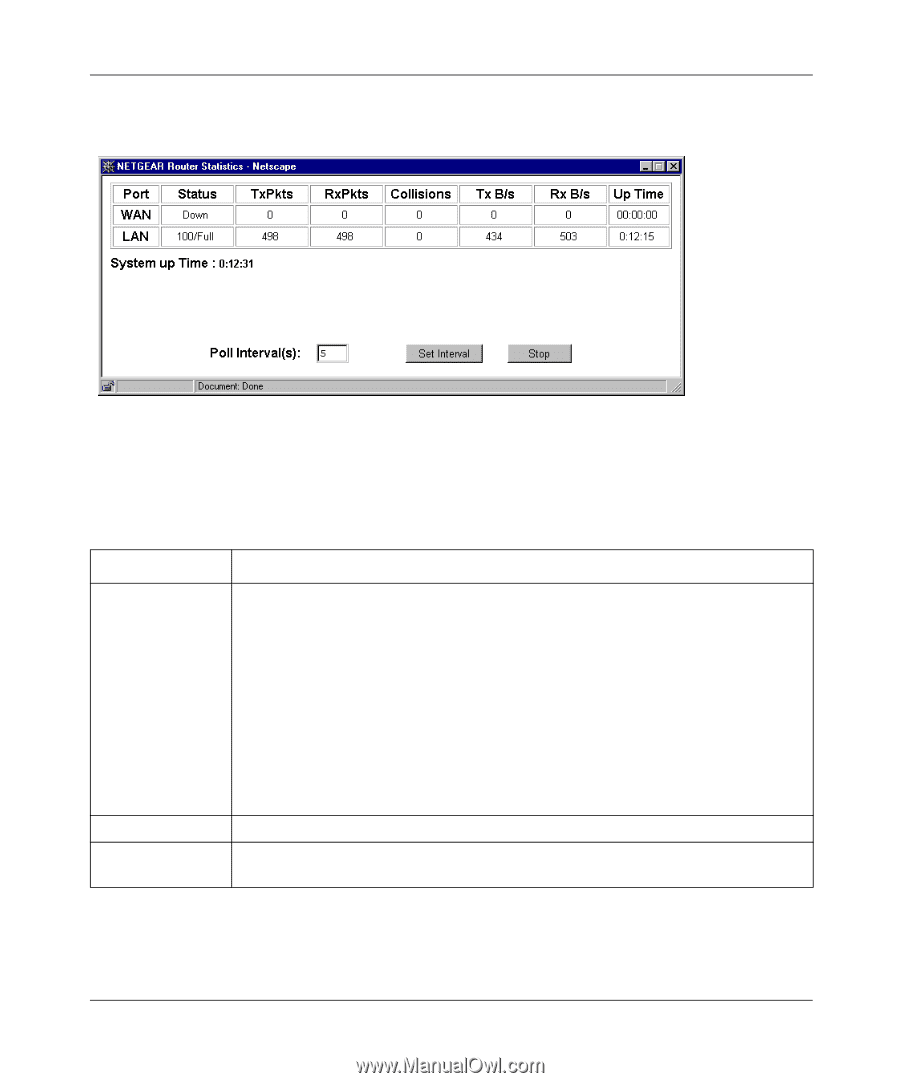
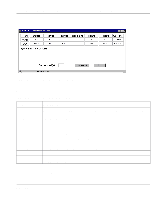
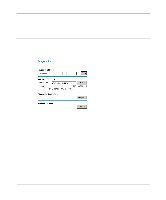
Reference Manual for the Model FR114P, FR114W and FM114P Cable/DSL ProSafe Firewall Click on the "Show Statistics" button to display firewall usage statistics, as shown in Figure 8-2 below: Figure 8-2. Router Statistics screen This screen shows the following statistics:. Table 8-2. Router Statistics Fields Field Port Status TxPkts RxPkts Collisions Tx B/s Tx B/s Up Time System up Time Poll Interval Description The statistics for the WAN (Internet) and LAN (local) ports. For each port, the screen displays: The link status of the port. The number of packets transmitted on this port since reset or manual clear. The number of packets received on this port since reset or manual clear. The number of collisions on this port since reset or manual clear. The current line utilization-percentage of current bandwidth used on this port. The average line utilization -average CLU for this port. The time elapsed since this port acquired link. The time elapsed since the last power cycle or reset. Specifies the intervals at which the statistics are updated in this window. Click on Stop to freeze the display. Click on the "Show PPPoE Status" button to display the progress of the PPPoE connection, as shown in Figure 8-2. Maintenance 8-3
-
 1
1 -
2
-
3
-
4
-
5
-
6
-
7
-
8
-
9
-
10
-
11
-
12
-
13
-
14
-
15
-
16
-
17
-
18
-
19
-
20
-
21
-
22
-
23
-
24
-
25
-
26
-
27
-
28
-
29
-
30
-
31
-
32
-
33
-
34
-
35
-
36
-
37
-
38
-
39
-
40
-
41
-
42
-
43
-
44
-
45
-
46
-
47
-
48
-
49
-
50
-
51
-
52
-
53
-
54
-
55
-
56
-
57
-
58
-
59
-
60
-
61
-
62
-
63
-
64
-
65
-
66
-
67
-
68
-
69
-
70
-
71
-
72
-
73
-
74
-
75
-
76
-
77
-
78
-
79
-
80
-
81
-
82
-
83
-
84
-
85
-
86
-
87
-
88
-
89
-
90
-
91
-
 92
92 -
 93
93 -
 94
94 -
 95
95 -
 96
96 -
 97
97 -
 98
98 -
 99
99 -
 100
100 -
 101
101 -
 102
102 -
103
-
104
-
105
-
106
-
107
-
108
-
109
-
110
-
111
-
112
-
113
-
114
-
115
-
116
-
117
-
118
-
119
-
120
-
121
-
122
-
123
-
124
-
125
-
126
-
127
-
128
-
129
-
130
-
131
-
132
-
133
-
134
-
135
-
136
-
137
-
138
-
139
-
140
-
141
-
142
-
143
-
144
-
145
-
146
-
147
-
148
-
149
-
150
 |
 |