Adobe 22011292 User Manual - Page 72
Dynamics Processing effect, Dynamics tab
 |
UPC - 883919139081
View all Adobe 22011292 manuals
Add to My Manuals
Save this manual to your list of manuals |
Page 72 highlights
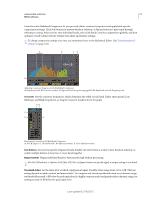
USING ADOBE AUDITION 68 Effects reference The graph reveals the processed frequencies. Click the Preview button to see how much audio content exists in the processed range. Mode Choose Broadband to uniformly compress all frequencies or Multiband to only compress the sibilance range. Multiband is best for most audio content but slightly increases processing time. Threshold Sets the amplitude above which compression occurs. Center Frequency Specifies the frequency at which sibilance is most intense. To verify, adjust this setting while playing audio. Bandwidth Determines the frequency range that triggers the compressor. To visually adjust Center Frequency and Bandwidth, drag the edges of the selection in the graph. Output Sibilance Only Lets you hear detected sibilance. Start playback, and fine-tune settings above. Gain Reduction Shows the compression level of the processed frequencies. More Help topics "Applying effects in the Waveform Editor" on page 62 "Applying effects in the Multitrack Editor" on page 63 Dynamics Processing effect The Amplitude And Compression > Dynamics Processing effect can be used as a compressor, limiter, or expander. As a compressor and limiter, this effect reduces dynamic range, producing consistent volume levels. As an expander, it increases dynamic range by reducing the level of low-level signals. (With extreme expander settings, you can create a noise gate that totally eliminates noise below a specific amplitude threshold.) The Dynamics Processing effect can produce subtle changes that you notice only after repeated listening. When applying this effect in the Waveform Editor, use a copy of the original file so you can return to the original audio if necessary. Use the Broadcast Limiter preset to simulate the processed sound of a contemporary radio station. More Help topics "Applying effects in the Waveform Editor" on page 62 "Applying effects in the Multitrack Editor" on page 63 "Control effect settings with graphs" on page 61 "Use effect presets" on page 61 Dynamics tab Graph Depicts input level along the horizontal ruler (x-axis) and the new output level along the vertical ruler (y-axis). The default graph, with a straight line from the lower left to the upper right, depicts a signal that has been left untouched; every input level has the same output level. Adjusting the graph changes the relationship between input and output levels, altering dynamic range. Last updated 2/16/2012
-
 1
1 -
2
-
3
-
4
-
5
-
6
-
7
-
8
-
9
-
10
-
11
-
12
-
13
-
14
-
15
-
16
-
17
-
18
-
19
-
20
-
21
-
22
-
23
-
24
-
25
-
26
-
27
-
28
-
29
-
30
-
31
-
32
-
33
-
34
-
35
-
36
-
37
-
38
-
39
-
40
-
41
-
42
-
43
-
44
-
45
-
46
-
47
-
48
-
49
-
50
-
51
-
52
-
53
-
54
-
55
-
56
-
57
-
58
-
59
-
60
-
61
-
62
-
63
-
64
-
65
-
66
-
 67
67 -
 68
68 -
 69
69 -
 70
70 -
 71
71 -
 72
72 -
 73
73 -
 74
74 -
 75
75 -
 76
76 -
 77
77 -
78
-
79
-
80
-
81
-
82
-
83
-
84
-
85
-
86
-
87
-
88
-
89
-
90
-
91
-
92
-
93
-
94
-
95
-
96
-
97
-
98
-
99
-
100
-
101
-
102
-
103
-
104
-
105
-
106
-
107
-
108
-
109
-
110
-
111
-
112
-
113
-
114
-
115
-
116
-
117
-
118
-
119
-
120
-
121
-
122
-
123
-
124
-
125
-
126
-
127
-
128
-
129
-
130
-
131
-
132
-
133
-
134
-
135
-
136
-
137
-
138
-
139
-
140
-
141
-
142
-
143
-
144
-
145
-
146
-
147
 |
 |
