Adobe 22011292 User Manual - Page 93
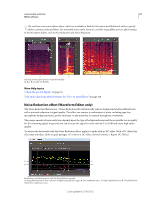
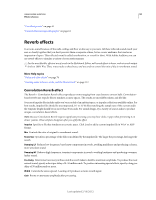
Output Noise Only, Noise Print Snapshots
 |
UPC - 883919139081
View all Adobe 22011292 manuals
Add to My Manuals
Save this manual to your list of manuals |
Page 93 highlights
USING ADOBE AUDITION 89 Effects reference Scale Determines how frequencies are arranged along the horizontal x-axis: • For finer control over low frequencies, select Logarithmic. A logarithmic scale more closely resembles how people hear sound. • For detailed, high-frequency work with evenly spaced intervals in frequency, select Linear. Channel Displays the selected channel in the graph. The amount of noise reduction is always the same for all channels. Select Entire File Lets you apply a captured noise print to the entire file. Noise Reduction Controls the percentage of noise reduction in the output signal. Fine-tune this setting while previewing audio to achieve maximum noise reduction with minimum artifacts. (Excessively high noise reduction levels can sometimes cause audio to sound flanged or out-of-phase.) Reduce By Determines the amplitude reduction of detected noise. Values between 6 and 30 dB work well. To reduce bubbly artifacts, enter lower values. Output Noise Only Previews only noise so you determine if the effect is removing any desirable audio. Advanced settings Click the triangle to display the following options: • Spectral Decay Rate Specifies the percentage of frequencies processed when audio falls below the noise floor. Fine-tuning this percentage allows greater noise reduction with fewer artifacts. Values of 40% to 75% work best. Below those values, bubbly-sounding artifacts are often heard; above those values, excessive noise typically remains. • Smoothing Takes into account the variance of the noise signal in each frequency band. Bands that vary greatly when analyzed (such as white noise) will be smoothed differently than constant bands (like 60-Hz hum). In general, increasing the smoothing amount (up to 2 or so) reduces burbly background artifacts at the expense of raising the overall background broadband noise level. • Precision Factor Controls changes in amplitude. Values of 5-10 work best, and odd numbers are ideal for symmetrical processing. With values of 3 or less, the Fast Fourier transform is performed in giant blocks, and between them drops or spikes in volume can occur. Values beyond 10 cause no noticeable change in quality, but they increase processing time. • Transition Width Determines the amplitude range between noise and desirable audio. For example, a width of zero applies a sharp, noise gate to each frequency band. Audio just above the threshold remains; audio just below is truncated to silence. Alternatively, you can specify a range over which the audio fades to silence based upon the input level. For example, if the transition width is 10 dB, and the noise level for the band is -60 dB, audio at -60 dB stays the same, audio at -62 dB is reduced slightly, and audio at -70 dB is removed entirely. • FFT Size Determines how many individual frequency bands are analyzed. This option causes the most drastic changes in quality. The noise in each frequency band is treated separately, so with more bands, noise is removed with finer frequency detail. Good settings range from 4096 to 8192. Fast Fourier Transform size determines the tradeoff between frequency- and time-accuracy. Higher FFT sizes might cause swooshing or reverberant artifacts, but they very accurately remove noise frequencies. Lower FFT sizes result in better time response (less swooshing before cymbal hits, for example), but they can produce poorer frequency resolution, creating hollow or flanged sounds. • Noise Print Snapshots Determines how many snapshots of noise to include in the captured profile. A value of 4000 is optimal for producing accurate data. Very small values greatly affect the quality of the various noise reduction levels. With more snapshots, a noise reduction level of 100 will likely cut out more noise, but also cut out more original signal. However, a low noise reduction level with more snapshots will also cut out more noise, but likely retain the intended signal. Last updated 2/16/2012
-
 1
1 -
2
-
3
-
4
-
5
-
6
-
7
-
8
-
9
-
10
-
11
-
12
-
13
-
14
-
15
-
16
-
17
-
18
-
19
-
20
-
21
-
22
-
23
-
24
-
25
-
26
-
27
-
28
-
29
-
30
-
31
-
32
-
33
-
34
-
35
-
36
-
37
-
38
-
39
-
40
-
41
-
42
-
43
-
44
-
45
-
46
-
47
-
48
-
49
-
50
-
51
-
52
-
53
-
54
-
55
-
56
-
57
-
58
-
59
-
60
-
61
-
62
-
63
-
64
-
65
-
66
-
67
-
68
-
69
-
70
-
71
-
72
-
73
-
74
-
75
-
76
-
77
-
78
-
79
-
80
-
81
-
82
-
83
-
84
-
85
-
86
-
87
-
 88
88 -
 89
89 -
 90
90 -
 91
91 -
 92
92 -
 93
93 -
 94
94 -
 95
95 -
 96
96 -
 97
97 -
 98
98 -
99
-
100
-
101
-
102
-
103
-
104
-
105
-
106
-
107
-
108
-
109
-
110
-
111
-
112
-
113
-
114
-
115
-
116
-
117
-
118
-
119
-
120
-
121
-
122
-
123
-
124
-
125
-
126
-
127
-
128
-
129
-
130
-
131
-
132
-
133
-
134
-
135
-
136
-
137
-
138
-
139
-
140
-
141
-
142
-
143
-
144
-
145
-
146
-
147
 |
 |
