Behringer DEEPMIND 12D Manual - Page 20
Seq Status, Midi Sync Source, Bpm Value
 |
View all Behringer DEEPMIND 12D manuals
Add to My Manuals
Save this manual to your list of manuals |
Page 20 highlights
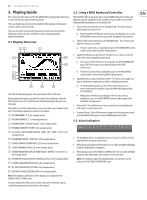
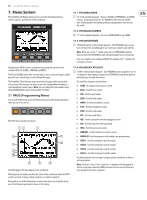
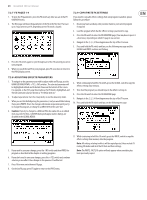
20 DeepMind 12D User Manual 7.1.5 SEQ STATUS, MIDI SYNC SOURCE, BPM VALUE (5) It is important to note that on this line there are four separate pieces of information: • SEQ STATUS ("SEQ" in the example diagram) - This shows the status of the CONTROL SEQUENCER. If the letters SEQ are inverted (white on a black background) then the CONTROL SEQUENCER is ON. If the letters SEQ appear as normal text the CONTROL SEQUENCER is OFF. Note: The CONTROL SEQUENCER ON/OFF control can only be adjusted from the CONTROL SEQUENCER MENU described later in this document. • MASTER BPM SOURCE ("MIDI" in the example diagram) - The Master BPM can be generated internally (shown as "INT"), or the DeepMind 12D can synchronize to an incoming MIDI clock signal from the MIDI IN socket (shown as "MIDI"), or USB ports (shown as "USB"). If the letters are inverted (white on a black background) then the clock is synchronised to the external source. If the letters appear as normal text the external source is not present and the DeepMind 12D will use its internal Master BPM until the external source is present. Note: The settings for the MIDI SYNC can be found in the EDIT page of the ARPEGGIATOR described later in this document. • BPM VALUE ("BPM:140.0" in the example diagram) - The Arpeggiator, Control Sequencer and Patterns use a system-wide Master BPM (Beats Per Minute) Clock. The BPM is shown and will auto update if using an external synchronisation source. • HAPPY FACE ICON This icon in the far right of the line shows that the current program has been saved in the list of favorites (see section 4.5 Favorites). 7.1.6 PARAMETER CONTROL (6) ("POLY UNI" in the example diagram) - This is a fader representation of the parameter which is currently being adjusted (or was last adjusted). The name of the parameter is also shown: If the position of the fader matches the position of the stored value, the fader will be black. 7.1.7 CURRENT PARAMETER MIDI VALUE (7) (255 in the example diagram) - This is the value of the parameter which is currently being adjusted (or was last adjusted). Note: The parameter is displayed here as a simple value (0-255) which allows you to quickly compare current and stored values. For explicit values please see the area at the bottom of the page discussed later in this chapter. 7.1.8 STORED PARAMETER VALUE (8) (20 in the example diagram) - This is the stored value of the parameter which is currently being adjusted (or was last adjusted). The stored parameter is always shown in reverse text (i.e. white on a black background) 7.1.9 CURRENT PARAMETER NAME/VALUE (9) ("DETUNE +/-50.0cents" in the example diagram) - In this area you will see more detailed information on the parameter being adjusted. The enhanced information contains: • A more detailed description of the parameter being adjusted. • A more accurate value of the parameter being adjusted. • The type of units used for the value (cents in the example above, but could be Hz for frequency etc.). 7.1.10 PARAMETER VISUALIZATION (10) (The UNISON waveform in the example diagram) - This area shows a visualization of the parameter being adjusted (or last adjusted). These visualizations are designed to: • Help anyone with limited experience to achieve a deeper understanding of each of the parameters while learning the synthesizer. • Help the experienced player/sound designer/programmer to work quickly and get visual confirmation about the adjustment being made. 7.1.11 VCA ENV VISUALIZATION (11) (VCA ENV in the example diagram) - This area shows a visualization of the VCA envelope. The full Attack, Decay, Sustain, Release and their respective curves are represented. If the fader does not match the position, it will be white with a superimposed arrow pointing in the direction it needs to move in order to approach the stored value. There is also a thin vertical white bar to show how far the fader needs to move in order to match the stored value. 7.1.12 VCF ENV VISUALIZATION (12) (VCF ENV in the example diagram)- This area shows a visualization of the VCF envelope. The full Attack, Decay, Sustain, Release and their respective curves are represented. 7.1.13 MOD ENV VISUALIZATION (13) (MOD ENV in the example diagram) - This area shows a visualization of the MOD envelope. The full Attack, Decay, Sustain, Release and their respective curves are represented. Note: If the physical fader position is close to the stored value the white bar can be obscured by the fader.
-
 1
1 -
2
-
3
-
4
-
5
-
6
-
7
-
8
-
9
-
10
-
11
-
12
-
13
-
14
-
 15
15 -
 16
16 -
 17
17 -
 18
18 -
 19
19 -
 20
20 -
 21
21 -
 22
22 -
 23
23 -
 24
24 -
 25
25 -
26
-
27
-
28
-
29
-
30
-
31
-
32
-
33
-
34
-
35
-
36
-
37
-
38
-
39
-
40
-
41
-
42
-
43
-
44
-
45
-
46
-
47
-
48
-
49
-
50
-
51
-
52
-
53
-
54
-
55
-
56
-
57
-
58
-
59
-
60
-
61
-
62
-
63
-
64
-
65
-
66
-
67
-
68
-
69
-
70
-
71
-
72
-
73
-
74
-
75
-
76
-
77
-
78
-
79
-
80
-
81
-
82
-
83
-
84
-
85
-
86
-
87
-
88
-
89
-
90
-
91
-
92
-
93
-
94
-
95
-
96
-
97
-
98
-
99
-
100
-
101
-
102
-
103
-
104
-
105
-
106
-
107
-
108
-
109
-
110
-
111
-
112
-
113
-
114
-
115
-
116
-
117
-
118
-
119
-
120
-
121
-
122
-
123
-
124
-
125
-
126
-
127
-
128
-
129
-
130
-
131
-
132
-
133
-
134
-
135
-
136
-
137
-
138
-
139
-
140
-
141
-
142
-
143
-
144
-
145
-
146
-
147
-
148
-
149
-
150
-
151
-
152
-
153
-
154
-
155
-
156
-
157
-
158
-
159
-
160
-
161
-
162
 |
 |
