Dell PowerConnect OpenManage Network Manager OpenManage Network Manager User G - Page 266
Create an SNMP Interface Monitor, Low, Medium, Overload
 |
View all Dell PowerConnect OpenManage Network Manager manuals
Add to My Manuals
Save this manual to your list of manuals |
Page 266 highlights
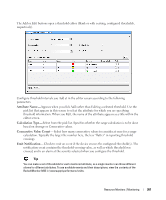
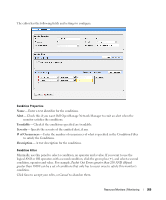
How To: Create an SNMP Interface Monitor To set up a typical performance monitor, follow these steps: 1 In the Resource Monitors portlet, and create a new monitor by right-clicking and selecting New. 2 Select the type of monitor from the submenu-for this example, an SNMP Interfaces monitor. NOTE: Some devices have ports rather than interfaces. This monitor works for them too, even though it is an "interface" monitor. 3 In the General screen, enter a polling interval (5 minutes is the default). For this example, check Retain polled data and accept the remaining defaults for checkboxes and the retention policy. 4 Select an entity to monitor by clicking the Add button in the top portion of the Monitor Options screen. For an interface monitor, select Interface as the Type at the top of the screen. You can also filter the list of interfaces that appear further by selecting Interface Type as ge (gigabit ethernet), for example. Tip Notice that you can add refinements like filtering on Administrative State and IP Address to the filter. 5 Select interfaces (Ctrl+click to add more than one), then click Add Selection then Done to confirm your entity. Tip Hover your cursor over a line describing an interface to have a more complete description appear as a popup. 6 Click Browse to display the MIB Browser. For the sake of this example, we elect to monitor ifInErrors (in RFC Standard MIBs, RFC1213-MIB > Nodes > mib-2 > interfaces > ifTable > ifEntry > ifInErrors). 7 In the Thresholds screen, configure thresholds by first clicking Add. 8 Click Add above the threshold levels list for each threshold you want to add. 9 In the threshold editor, enter a name (Examples: Low, Medium, Overload), an upper and lower boundary, (0 - 10, 10 - 100, 100+), a severity (Informational, Warning, Critical) and color (BLUE, YELLOW, RED). In this case, no string matching is necessary. When the data crosses thresholds, the monitor reacts. 266 Resource Monitors | Monitoring
-
 1
1 -
2
-
3
-
4
-
5
-
6
-
7
-
8
-
9
-
10
-
11
-
12
-
13
-
14
-
15
-
16
-
17
-
18
-
19
-
20
-
21
-
22
-
23
-
24
-
25
-
26
-
27
-
28
-
29
-
30
-
31
-
32
-
33
-
34
-
35
-
36
-
37
-
38
-
39
-
40
-
41
-
42
-
43
-
44
-
45
-
46
-
47
-
48
-
49
-
50
-
51
-
52
-
53
-
54
-
55
-
56
-
57
-
58
-
59
-
60
-
61
-
62
-
63
-
64
-
65
-
66
-
67
-
68
-
69
-
70
-
71
-
72
-
73
-
74
-
75
-
76
-
77
-
78
-
79
-
80
-
81
-
82
-
83
-
84
-
85
-
86
-
87
-
88
-
89
-
90
-
91
-
92
-
93
-
94
-
95
-
96
-
97
-
98
-
99
-
100
-
101
-
102
-
103
-
104
-
105
-
106
-
107
-
108
-
109
-
110
-
111
-
112
-
113
-
114
-
115
-
116
-
117
-
118
-
119
-
120
-
121
-
122
-
123
-
124
-
125
-
126
-
127
-
128
-
129
-
130
-
131
-
132
-
133
-
134
-
135
-
136
-
137
-
138
-
139
-
140
-
141
-
142
-
143
-
144
-
145
-
146
-
147
-
148
-
149
-
150
-
151
-
152
-
153
-
154
-
155
-
156
-
157
-
158
-
159
-
160
-
161
-
162
-
163
-
164
-
165
-
166
-
167
-
168
-
169
-
170
-
171
-
172
-
173
-
174
-
175
-
176
-
177
-
178
-
179
-
180
-
181
-
182
-
183
-
184
-
185
-
186
-
187
-
188
-
189
-
190
-
191
-
192
-
193
-
194
-
195
-
196
-
197
-
198
-
199
-
200
-
201
-
202
-
203
-
204
-
205
-
206
-
207
-
208
-
209
-
210
-
211
-
212
-
213
-
214
-
215
-
216
-
217
-
218
-
219
-
220
-
221
-
222
-
223
-
224
-
225
-
226
-
227
-
228
-
229
-
230
-
231
-
232
-
233
-
234
-
235
-
236
-
237
-
238
-
239
-
240
-
241
-
242
-
243
-
244
-
245
-
246
-
247
-
248
-
249
-
250
-
251
-
252
-
253
-
254
-
255
-
256
-
257
-
258
-
259
-
260
-
 261
261 -
 262
262 -
 263
263 -
 264
264 -
 265
265 -
 266
266 -
 267
267 -
 268
268 -
 269
269 -
 270
270 -
 271
271 -
272
-
273
-
274
-
275
-
276
-
277
-
278
-
279
-
280
-
281
-
282
-
283
-
284
-
285
-
286
-
287
-
288
-
289
-
290
-
291
-
292
-
293
-
294
-
295
-
296
-
297
-
298
-
299
-
300
-
301
-
302
-
303
-
304
-
305
-
306
-
307
-
308
-
309
-
310
-
311
-
312
-
313
-
314
-
315
-
316
-
317
-
318
-
319
-
320
-
321
-
322
-
323
-
324
-
325
-
326
-
327
-
328
-
329
-
330
-
331
-
332
-
333
-
334
-
335
-
336
-
337
-
338
-
339
-
340
-
341
-
342
-
343
-
344
-
345
-
346
-
347
-
348
-
349
-
350
-
351
-
352
-
353
-
354
-
355
-
356
-
357
-
358
-
359
-
360
-
361
-
362
-
363
-
364
-
365
-
366
-
367
-
368
-
369
-
370
-
371
-
372
-
373
-
374
-
375
-
376
-
377
-
378
-
379
-
380
-
381
-
382
-
383
-
384
 |
 |