Garmin G3X Pilots Guide - Page 205
Freezing Levels, Turbulence Forecast
 |
View all Garmin G3X manuals
Add to My Manuals
Save this manual to your list of manuals |
Page 205 highlights
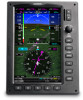
Hazard Avoidance FREEZING LEVELS Freezing Level shows contours for the lowest forecast altitude where icing conditions are likely to occur. System Overview Flight Instruments EIS CNS Interface GPS Navigation Flight Planning Hazard Avoidance Additional Features Integrated Autopilot Freezing Level Data TURBULENCE FORECAST Turbulence data identifies the potential for erratic movement of high-altitude air mass associated winds. Turbulence is classified as light, moderate, severe, or extreme. Turbulence data is intended to supplement AIRMETs and SIGMETs. Turbulence Forecast Legend Severe Turbulence Selected With Map Pointer (Split-Screen) 190-01115-00 Rev. F Garmin G3X Pilot's Guide 187 Annun/Alerts Appendix Index
-
 1
1 -
2
-
3
-
4
-
5
-
6
-
7
-
8
-
9
-
10
-
11
-
12
-
13
-
14
-
15
-
16
-
17
-
18
-
19
-
20
-
21
-
22
-
23
-
24
-
25
-
26
-
27
-
28
-
29
-
30
-
31
-
32
-
33
-
34
-
35
-
36
-
37
-
38
-
39
-
40
-
41
-
42
-
43
-
44
-
45
-
46
-
47
-
48
-
49
-
50
-
51
-
52
-
53
-
54
-
55
-
56
-
57
-
58
-
59
-
60
-
61
-
62
-
63
-
64
-
65
-
66
-
67
-
68
-
69
-
70
-
71
-
72
-
73
-
74
-
75
-
76
-
77
-
78
-
79
-
80
-
81
-
82
-
83
-
84
-
85
-
86
-
87
-
88
-
89
-
90
-
91
-
92
-
93
-
94
-
95
-
96
-
97
-
98
-
99
-
100
-
101
-
102
-
103
-
104
-
105
-
106
-
107
-
108
-
109
-
110
-
111
-
112
-
113
-
114
-
115
-
116
-
117
-
118
-
119
-
120
-
121
-
122
-
123
-
124
-
125
-
126
-
127
-
128
-
129
-
130
-
131
-
132
-
133
-
134
-
135
-
136
-
137
-
138
-
139
-
140
-
141
-
142
-
143
-
144
-
145
-
146
-
147
-
148
-
149
-
150
-
151
-
152
-
153
-
154
-
155
-
156
-
157
-
158
-
159
-
160
-
161
-
162
-
163
-
164
-
165
-
166
-
167
-
168
-
169
-
170
-
171
-
172
-
173
-
174
-
175
-
176
-
177
-
178
-
179
-
180
-
181
-
182
-
183
-
184
-
185
-
186
-
187
-
188
-
189
-
190
-
191
-
192
-
193
-
194
-
195
-
196
-
197
-
198
-
199
-
 200
200 -
 201
201 -
 202
202 -
 203
203 -
 204
204 -
 205
205 -
 206
206 -
 207
207 -
 208
208 -
 209
209 -
 210
210 -
211
-
212
-
213
-
214
-
215
-
216
-
217
-
218
-
219
-
220
-
221
-
222
-
223
-
224
-
225
-
226
-
227
-
228
-
229
-
230
-
231
-
232
-
233
-
234
-
235
-
236
-
237
-
238
-
239
-
240
-
241
-
242
-
243
-
244
-
245
-
246
-
247
-
248
-
249
-
250
-
251
-
252
-
253
-
254
-
255
-
256
-
257
-
258
-
259
-
260
-
261
-
262
-
263
-
264
-
265
-
266
-
267
-
268
-
269
-
270
-
271
-
272
-
273
-
274
-
275
-
276
-
277
-
278
-
279
-
280
-
281
-
282
-
283
-
284
-
285
-
286
-
287
-
288
-
289
-
290
-
291
-
292
-
293
-
294
-
295
-
296
-
297
-
298
-
299
-
300
-
301
-
302
-
303
-
304
-
305
-
306
-
307
-
308
-
309
-
310
-
311
-
312
-
313
-
314
-
315
-
316
-
317
-
318
-
319
-
320
-
321
-
322
-
323
-
324
-
325
-
326
-
327
-
328
-
329
-
330
-
331
-
332
-
333
-
334
-
335
-
336
-
337
-
338
-
339
-
340
-
341
-
342
-
343
-
344
-
345
-
346
-
347
-
348
-
349
-
350
-
351
-
352
-
353
-
354
-
355
-
356
-
357
-
358
-
359
-
360
-
361
-
362
-
363
-
364
-
365
-
366
-
367
-
368
-
369
-
370
-
371
-
372
 |
 |

Garmin G3X Pilot’s Guide
190-01115-00 Rev. F
187
Hazard Avoidance
System
Overview
Flight
Instruments
EIS
CNS
Interface
GPS
Navigation
Flight
Planning
Hazard
Avoidance
Additional
Features
Integrated
Autopilot
Annun/Alerts
Appendix
Index
FREEZING LEVELS
Freezing Level shows contours for the lowest forecast altitude where icing conditions
are likely to occur.
Freezing Level Data
TURBULENCE FORECAST
Turbulence data identifies the potential for erratic movement of high-altitude air
mass associated winds.
Turbulence is classified as light, moderate, severe, or extreme.
Turbulence data is intended to supplement AIRMETs and SIGMETs.
Severe Turbulence Selected With Map
Pointer (Split-Screen)
Turbulence Forecast Legend