Meade Tripod LX600-ACF 14 inch User Manual - Page 53
Appendix B
 |
View all Meade Tripod LX600-ACF 14 inch manuals
Add to My Manuals
Save this manual to your list of manuals |
Page 53 highlights
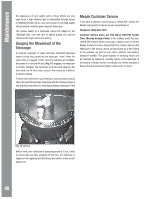
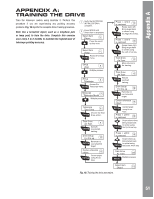
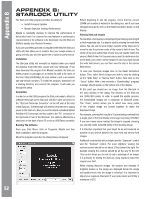
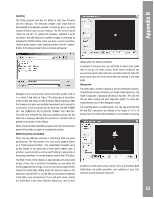
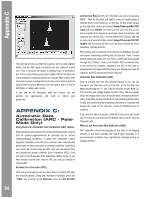
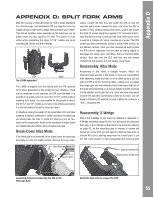
Appendix B Updating The Utility program also has the ability to load new firmware into the StarLock. The firmware release code must first be downloaded from Meade's website. It should be put in an easily located directory such as your desktop. The file will be named "StarLock_Vxy.Ldr". To update the firmware, establish a serial connection with the StarLock by getting images to download by pressing the FOCUS button. Once you have a good connection, click the button again to stop focusing and then click the "Update" button. A file dialog similar to the one below will appear: Navigate to the new firmware version and either double click on it, or select it and click on "Open." The status bar at the bottom of the screen will show you the firmware being download. After the firmware has been successfully downloaded and checked for correctness, it will be burned into the StarLock. DO NOT POWER OFF THE COMPUTER OR TELESCOPE DURING THIS PROCESS. Once the new firmware has been successfully burned into the StarLock a message indicating the operation is complete will be posted on the bottom of the display. NOTE: Close the StarLock Utility program and cycle the telescope power off and then on again to complete the update. Monitoring StarLock Guiding There are two different methods of monitoring StarLock guide performance. The first method is to look at the guiding history as a "Point Spread Function". This presentation basically sums up the images of the guide star at each guide update cycle. It provides a good prediction of how well tracking is going and on the seeing conditions. To use this method, click on the PSF button. The field of view of the display is approximately 20 arcseconds across. If your star is stretched horizontally, you are either not tracking aggressively enough, or you are tracking too aggressively. Change the Guide Rate setting under the StarLock menu on the telescope, reset the PSF or run the ARC as discussed in Appendix C and start a new measurement, if your star gets worse, change the Guide Rate in the other direction. Adjust your rate for best results with your seeing conditions. In general, if seeing is poor, you will need to reduce your guide rate so you do not chase seeing. Under better conditions you can increase guide rates until over correction starts to make the scope jump back and forth across the star making it too wide again. Histograms The other way to monitor tracking is with the histogram function. This plots how many corrections are made at each distance. The result is typically a Gaussian distribution function. The plot will tell you about seeing and your alignment quality. To make this measurement click on the Histogram button. The example above is pretty typical. You can see that both the RA and DEC corrections are plotted in the range of -8 to +8 arcseconds. The width of the distribution is an indication of seeing conditions. In this case seeing is about 1/5 to 2 arcminutes. Both distributions are pretty symmetric and centered on zero. This indicates a good telescope alignment. 53
-
 1
1 -
2
-
3
-
4
-
5
-
6
-
7
-
8
-
9
-
10
-
11
-
12
-
13
-
14
-
15
-
16
-
17
-
18
-
19
-
20
-
21
-
22
-
23
-
24
-
25
-
26
-
27
-
28
-
29
-
30
-
31
-
32
-
33
-
34
-
35
-
36
-
37
-
38
-
39
-
40
-
41
-
42
-
43
-
44
-
45
-
46
-
47
-
 48
48 -
 49
49 -
 50
50 -
 51
51 -
 52
52 -
 53
53 -
 54
54 -
 55
55 -
 56
56 -
 57
57 -
 58
58 -
59
-
60
-
61
-
62
-
63
-
64
-
65
-
66
-
67
-
68
-
69
-
70
-
71
-
72
 |
 |
