TP-Link Archer MR400 Archer MR400EU V1 User Guide - Page 75
Monitor the Internet Traffic Statistics, 12. 9. CWMP Settings, Save Locally, Save Remotely
 |
View all TP-Link Archer MR400 manuals
Add to My Manuals
Save this manual to your list of manuals |
Page 75 highlights
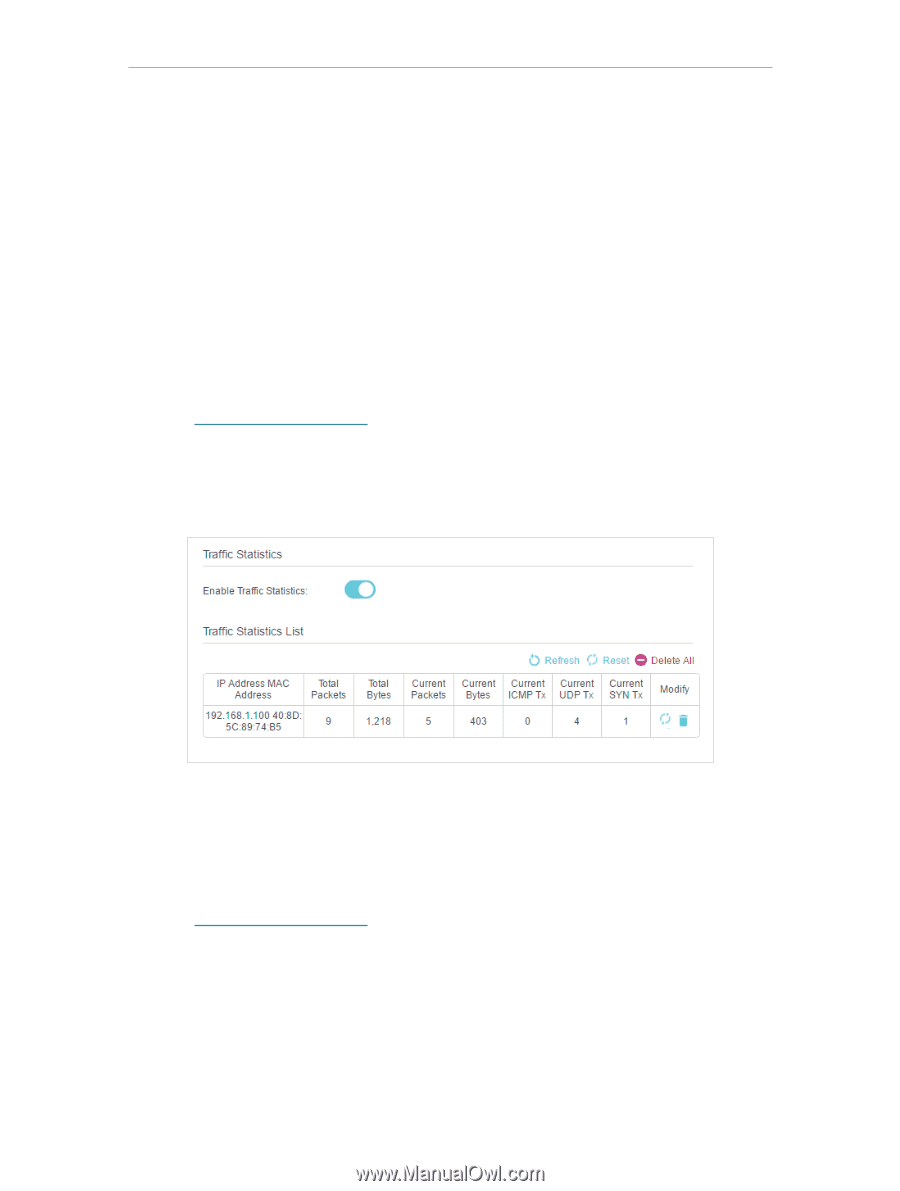
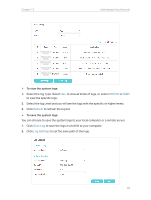
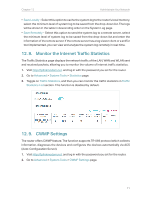
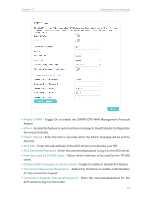
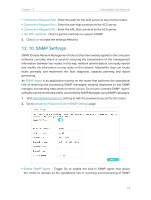
Chapter 12 Administrate Your Network • Save Locally - Select this option to cache the system log to the router's local memory, select the minimum level of system log to be saved from the drop-down list. The logs will be shown in the table in descending order on the System Log page. • Save Remotely - Select this option to send the system log to a remote server, select the minimum level of system log to be saved from the drop-down list and enter the information of the remote server. If the remote server has a log viewer client or a sniffer tool implemented, you can view and analyze the system log remotely in real-time. 12. 8. Monitor the Internet Traffic Statistics The Traffic Statistics page displays the network traffic of the LAN, WAN and WLAN sent and received packets, allowing you to monitor the volume of internet traffic statistics. 1. Visit http://tplinkmodem.net, and log in with the password you set for the router. 2. Go to Advanced > System Tools > Statistics page. 3. Toggle on Traffic Statistics, and then you can monitor the traffic statistics in Traffic Statistics List section. This function is disabled by default. 12. 9. CWMP Settings The router offers CWMP feature. The function supports TR-069 protocol which collects information, diagnoses the devices and configures the devices automatically via ACS (Auto-Configuration Server). 1. Visit http://tplinkmodem.net, and log in with the password you set for the router. 2. Go to Advanced > System Tools > CWMP Settings page. 71
-
 1
1 -
2
-
3
-
4
-
5
-
6
-
7
-
8
-
9
-
10
-
11
-
12
-
13
-
14
-
15
-
16
-
17
-
18
-
19
-
20
-
21
-
22
-
23
-
24
-
25
-
26
-
27
-
28
-
29
-
30
-
31
-
32
-
33
-
34
-
35
-
36
-
37
-
38
-
39
-
40
-
41
-
42
-
43
-
44
-
45
-
46
-
47
-
48
-
49
-
50
-
51
-
52
-
53
-
54
-
55
-
56
-
57
-
58
-
59
-
60
-
61
-
62
-
63
-
64
-
65
-
66
-
67
-
68
-
69
-
 70
70 -
 71
71 -
 72
72 -
 73
73 -
 74
74 -
 75
75 -
 76
76 -
 77
77 -
 78
78 -
 79
79 -
 80
80 -
81
-
82
-
83
-
84
-
85
-
86
-
87
-
88
-
89
-
90
-
91
-
92
-
93
 |
 |