Garmin GPSMAP 5215 Owner's Manual - Page 19
Using BlueChart g2 Vision, Detailed Roads and POI data
 |
View all Garmin GPSMAP 5215 manuals
Add to My Manuals
Save this manual to your list of manuals |
Page 19 highlights
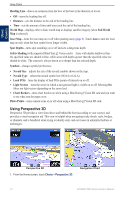
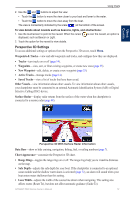
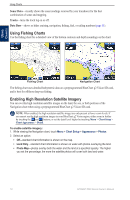
Using Charts Using Charts To set active Track Options: From the Home screen, touch Information > User Data > Tracks > Active Track Options. Record Mode-touch Off, Fill, or Wrap. • Off-does not record a track log. • Fill-records a track log until the track memory is full. • Wrap-continuously records the track log, replacing the oldest track data with new data. Interval-defines the frequency at which the track plot is recorded. Recording more-frequent plots is more accurate but fills the track log faster. • Interval-sets whether the interval is determined by distance, time, or resolution. (Touch Change to set the quantity.) ◦ Distance-records the track based on a distance between points. ◦ Time-records the track based on a time interval. ◦ Resolution-records the track plot based on a variance from your course. This setting is recommended for the most-efficient use of memory. The distance value (Change) is the maximum error allowed from the true course before recording a track point. • Change-sets the value of the interval. Track Color-sets the color of the track plot. Using BlueChart g2 Vision Optional BlueChart g2 Vision preprogrammed SD cards allow you to get the most out of your chartplotter. In addition to detailed marine charting, BlueChart g2 Vision has the following features: • Mariner's Eye 3D-provides a view from above and behind the boat for a three‑dimensional navigation aid. The BlueChart g2 Vision Mariner's Eye 3D is more detailed than the preloaded data. • Fish Eye 3D-provides an underwater, three-dimensional view that visually represents the sea floor according to the information on the chart. • Fishing Charts-displays the chart with enhanced bottom contours and without navigational data. This chart works well for offshore deep-sea fishing. • High Resolution Satellite Imagery-provides high resolution satellite images for a realistic view of the land and water on the Navigation chart. • Aerial Photos-displays marinas and other navigationally significant aerial photos to help you visualize your surroundings. • Detailed Roads and POI data-displays roads, restaurants, and other points of interest (POIs) along the shore. • Auto Guidance-uses specified boat safe depth and chart data to determine the best course to your destination. GPSMAP 5000 Series Owner's Manual 15
-
 1
1 -
2
-
3
-
4
-
5
-
6
-
7
-
8
-
9
-
10
-
11
-
12
-
13
-
 14
14 -
 15
15 -
 16
16 -
 17
17 -
 18
18 -
 19
19 -
 20
20 -
 21
21 -
 22
22 -
 23
23 -
 24
24 -
25
-
26
-
27
-
28
-
29
-
30
-
31
-
32
-
33
-
34
-
35
-
36
-
37
-
38
-
39
-
40
-
41
-
42
-
43
-
44
-
45
-
46
-
47
-
48
-
49
-
50
-
51
-
52
-
53
-
54
-
55
-
56
-
57
-
58
-
59
-
60
-
61
-
62
-
63
-
64
-
65
-
66
-
67
-
68
-
69
-
70
-
71
-
72
-
73
-
74
-
75
-
76
-
77
-
78
-
79
-
80
-
81
-
82
-
83
-
84
 |
 |