Garmin GPSMAP 5215 Owner's Manual - Page 68
Viewing Visibility Information
 |
View all Garmin GPSMAP 5215 manuals
Add to My Manuals
Save this manual to your list of manuals |
Page 68 highlights
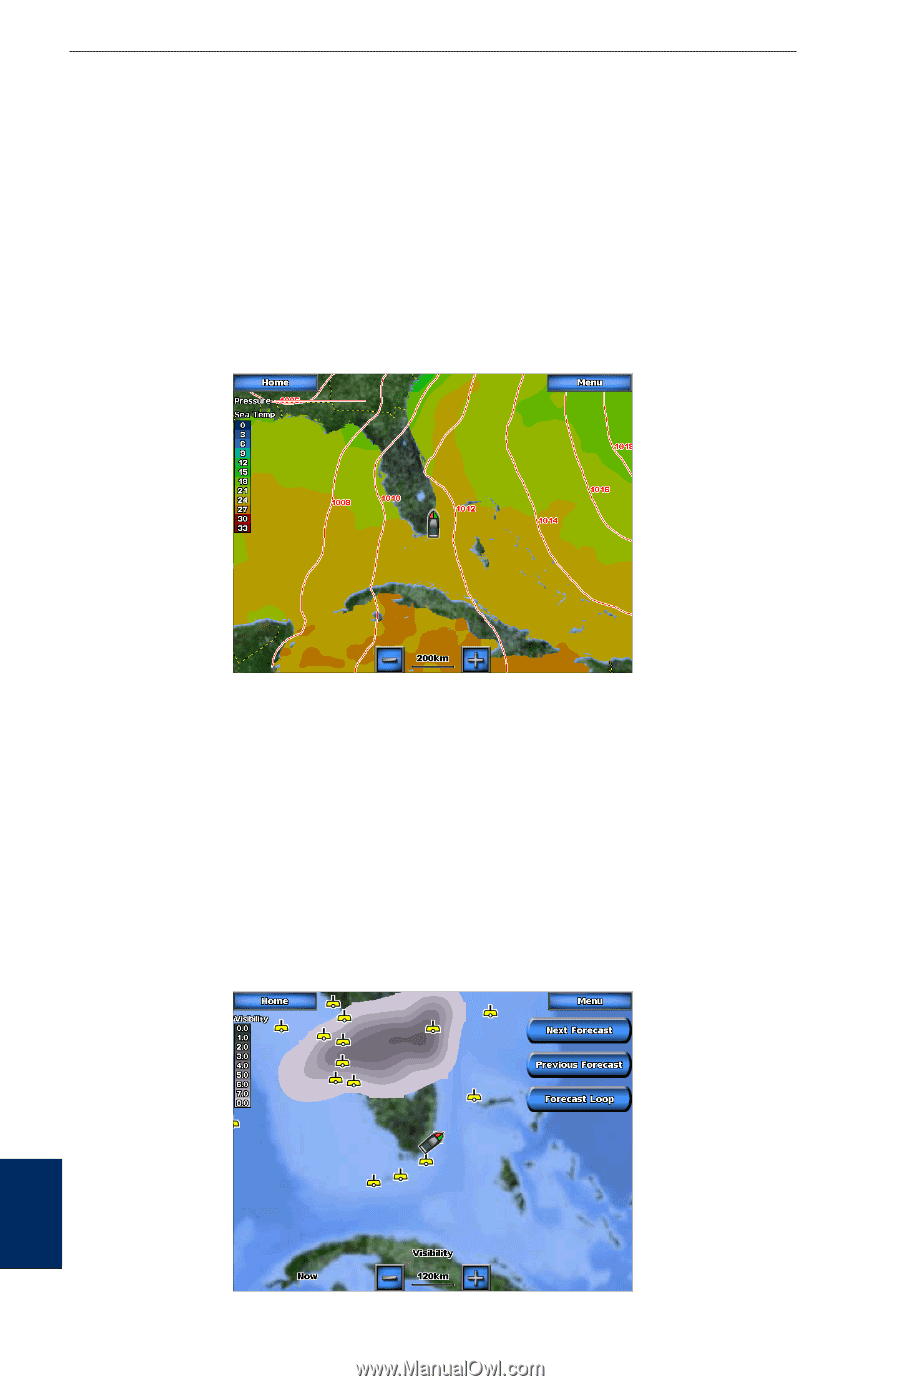
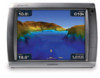
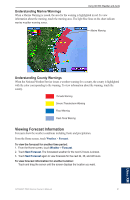
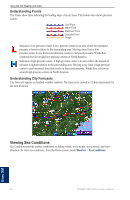
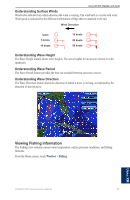
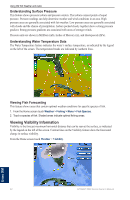
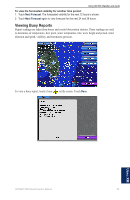
Using XM WX Weather and Audio Understanding Surface Pressure This feature shows pressure isobars and pressure centers. The isobars connect points of equal pressure. Pressure readings can help determine weather and wind conditions in an area. High pressure areas are generally associated with fair weather. Low pressure areas are generally associated with clouds and the chance of precipitation. Isobars packed closely together show a strong pressure gradient. Strong pressure gradients are associated with areas of stronger winds. Pressure units are shown in Millibars (mb), Inches of Mercury (in), and Hectopascals (hPa). Understanding Water Temperature Data The Water Temperature feature indicates the water's surface temperature, as indicated by the legend on the left of the screen. The temperature breaks are indicated by isotherm lines. Viewing Fish Forecasting This feature shows areas that contain optimal weather conditions for specific species of fish. 1. From the Home screen touch Weather > Fishing > Menu > Fish Species. 2. Touch a species of fish. Shaded areas indicate optimal fishing areas. Viewing Visibility Information Visibility is the forecast maximum horizontal distance that can be seen at the surface, as indicated by the legend on the left of the screen. Contour lines on the Visibility feature show the forecasted change in surface visibility. From the Home screen touch Weather > Visibility. 64 GPSMAP 5000 Series Owner's Manual Using XM
-
 1
1 -
2
-
3
-
4
-
5
-
6
-
7
-
8
-
9
-
10
-
11
-
12
-
13
-
14
-
15
-
16
-
17
-
18
-
19
-
20
-
21
-
22
-
23
-
24
-
25
-
26
-
27
-
28
-
29
-
30
-
31
-
32
-
33
-
34
-
35
-
36
-
37
-
38
-
39
-
40
-
41
-
42
-
43
-
44
-
45
-
46
-
47
-
48
-
49
-
50
-
51
-
52
-
53
-
54
-
55
-
56
-
57
-
58
-
59
-
60
-
61
-
62
-
 63
63 -
 64
64 -
 65
65 -
 66
66 -
 67
67 -
 68
68 -
 69
69 -
 70
70 -
 71
71 -
 72
72 -
 73
73 -
74
-
75
-
76
-
77
-
78
-
79
-
80
-
81
-
82
-
83
-
84
 |
 |