Garmin GPSMAP 5215 Owner's Manual - Page 22
Using Fishing Charts, Enabling High Resolution Satellite Imagery, Satellite Imagery
 |
View all Garmin GPSMAP 5215 manuals
Add to My Manuals
Save this manual to your list of manuals |
Page 22 highlights
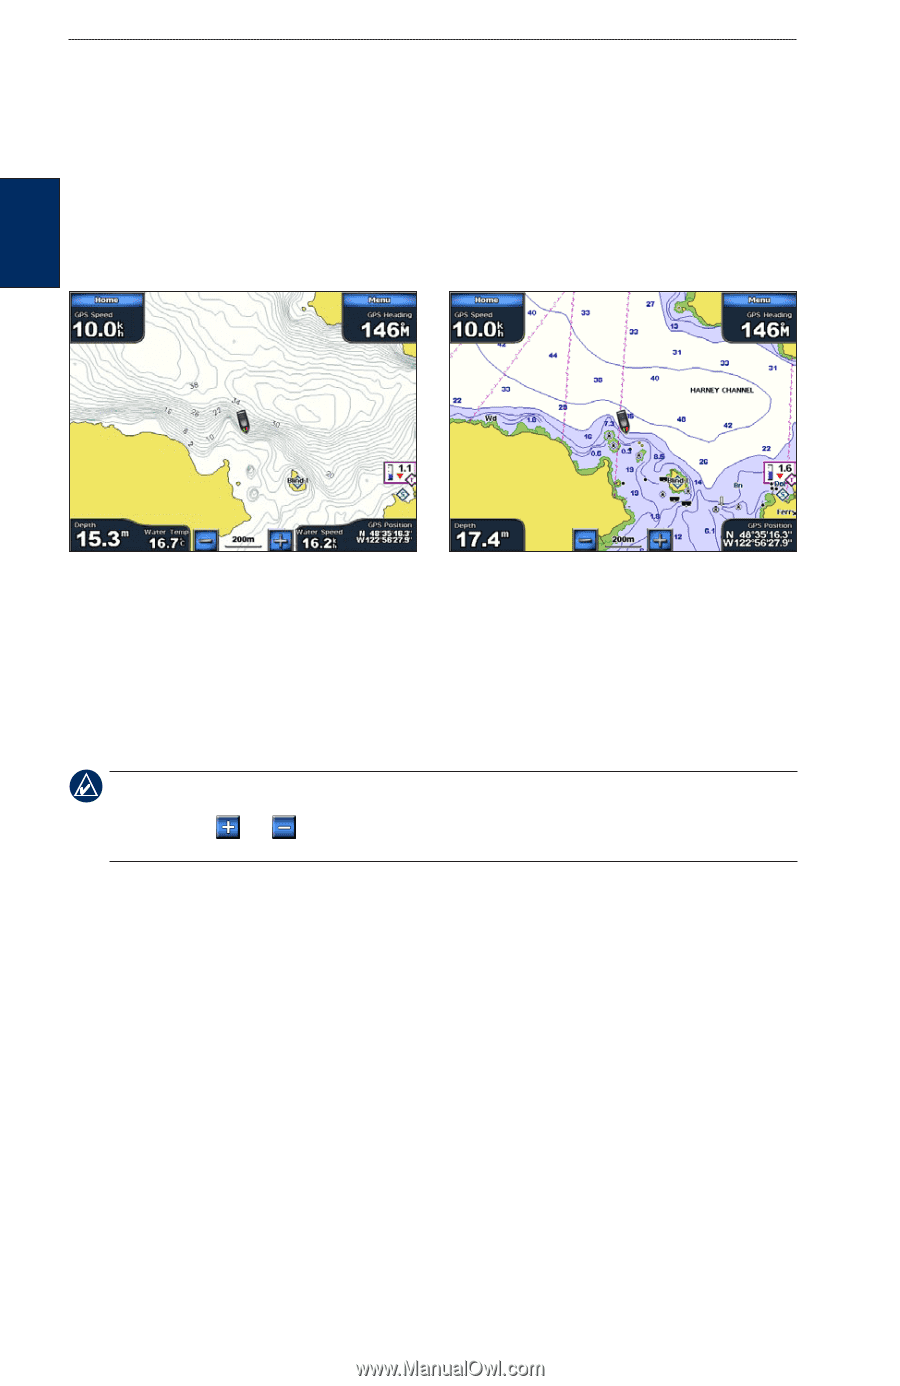
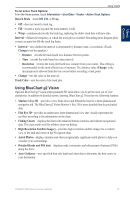
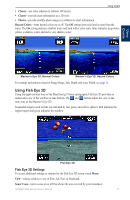
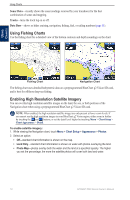
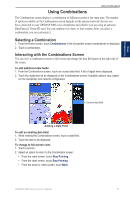
Using Charts Sonar Data-visually shows the sonar readings received by your transducer for the best combination of sonar and mapping. Tracks-turns the track log on or off. Data Bars-shows or hides cruising, navigation, fishing, fuel, or sailing numbers (page 11). Using Fishing Charts Use the fishing chart for a detailed view of the bottom contours and depth soundings on the chart. Using Charts Fishing Chart Navigation Chart The fishing chart uses detailed bathymetric data on a preprogrammed BlueChart g2 Vision SD card, and is best for offshore deep-sea fishing. Enabling �High Resolution Satellite Imagery You can overlay high-resolution satellite images on the land, the sea, or both portions of the Navigation chart when using a preprogrammed BlueChart g2 Vision SD card. NOTE: When enabled, the high resolution satellite images are only present at lower zoom levels. If you cannot see the high resolution images in your BlueChart g2 Vision region, either zoom in further by touching the and buttons, or set the detail level higher by touching Menu > Chart Setup > Chart Appearance > Detail. To enable satellite imagery: 1. While viewing the Navigation chart, touch Menu > Chart Setup > Appearance > Photos. 2. Select an option: • Off-standard chart information is shown on the map. • Land Only-standard chart information is shown on water with photos overlaying the land. • Photo Map-photos overlay both the water and the land at a specified opacity. The higher you set the percentage, the more the satellite photos will cover both land and water. 18 GPSMAP 5000 Series Owner's Manual
-
 1
1 -
2
-
3
-
4
-
5
-
6
-
7
-
8
-
9
-
10
-
11
-
12
-
13
-
14
-
15
-
16
-
 17
17 -
 18
18 -
 19
19 -
 20
20 -
 21
21 -
 22
22 -
 23
23 -
 24
24 -
 25
25 -
 26
26 -
 27
27 -
28
-
29
-
30
-
31
-
32
-
33
-
34
-
35
-
36
-
37
-
38
-
39
-
40
-
41
-
42
-
43
-
44
-
45
-
46
-
47
-
48
-
49
-
50
-
51
-
52
-
53
-
54
-
55
-
56
-
57
-
58
-
59
-
60
-
61
-
62
-
63
-
64
-
65
-
66
-
67
-
68
-
69
-
70
-
71
-
72
-
73
-
74
-
75
-
76
-
77
-
78
-
79
-
80
-
81
-
82
-
83
-
84
 |
 |